
System information

Using Web Publishing Service
411
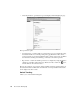
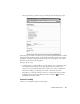
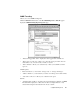
SNMP Trending
Allows you to view SNMP trending data.
Click the SNMP T
RENDING button on the Web Publishing Service Welcome page to
display the SNMP Trending Report Properties page.
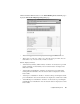
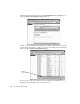
• “Dates with logged data” chart—displays the dates logged data is available for.
• “Report period” combo box—allows you to select the report period time. You can
select either: 1 day, 1 week, 2 weeks, 1 month, or custom.
• “Date” calendars—allows you to select the day or dates you would like to run the
report on.
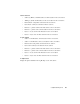
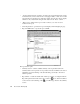
Chart Properties:
• Plots radio buttons—you can select “averages only” or “averages and ranges.”
• “Charts” checkbox—you can select if you want to view the reports in a chart format.
• “Auto-scale” combo box—allows you to select the scale option.
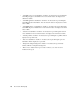
Statistic:
• “Summary table” checkbox—if selected, the report will capture a summary of SNMP.
The data will be displayed as a table. You can select to display all items or only
selected items using the radio buttons in the “Notes” column.