
System information

Packet Capture Mode
37
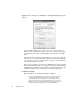
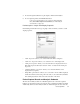
5. To clear the capture buffer and stop the capture, click the CLEAR button.
6. To view captured packets, click the Decode button.
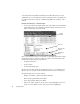
In most cases, Packet Capture is more useful if you apply appropriate
filters (Tools->Filter Setup for Selected Probe). See “Filter Setup for
Selected Probe” on page 219.
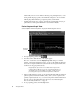
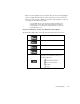
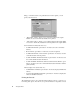
Packet Capture – Graph View Display Properties
Click Settings and the tab for the type of graph or chart for which you want to set the
display properties:
• “Item” dropdown—allows you to select which item will be configured.
• “Item color” dropdown—allows you to select the color of the display item.
• “Item plot” dropdown—allows you to select the item to be displayed as Lines or
Bars. This dropdown will only be active if “Lines” is selected in the “Item plot”
dropdown.
• “Item line thickness “dropdown—allows you to select the thickness of the
displayed item (in pixels).
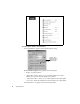
• Graph Time option buttons—allows you to set how the “X” axis will be displayed.
Clock time will show times using a 24-hour clock (i.e., the current time). Relative
time will display times from the start of the activation of the mode.
Packet Capture-Decode and Analysis Submode
The Decode and Analysis submode of Packet Capture mode is where the captured
buffer is decoded and the packet conversations can be examined and analyzed in detail.
Additionally, the Decode and Analysis submode of Packet Capture mode is where two