
System information
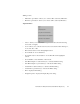

Efficiency History
73
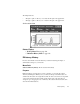
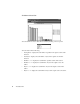
The Graph fields are:
• “3D depth” spinbox—allows you to select the 3D depth of the graph items.
• “3D angle” spinbox—allows you to select the 3D depth of the graph items.
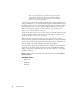
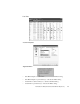
3D Line Chart View
Related Topics
•
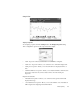
3D Step Chart View
on page 136.
•
Utilization History Mode
on page 132.
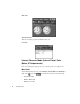
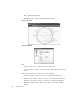
Efficiency History
Provides a benchmark of network efficiency, useful for measuring the impact of
administrative changes to your network.
Menu Path
Statistics->Efficiency History
. The mode starts immediately.
Purpose
Efficiency History was designed to provide a snapshot of your network’s current
efficiency. Running the efficiency test (over time) should provide similar values for
similar network loads from a single Observer PC. In other words, this test is dependent
on the network card in the Observer PC and the current load of the network. It is
designed to give an aggregate view of efficiency. The value should be about the same
when run in similar situations.