
System information

74
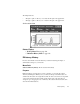
The Statistics Menu
Unlike most of the diagnostic modes, Efficiency History generates a
small amount of network traffic: 420 packets per minute on Ethernet
and 180 packets per minute on a Token Ring. Such small loads will
have no effect on network performance.
A common use for this mode is to judge the effectiveness, or lack of effectiveness, of
changes and alterations to your network setup/configuration. Many administrators use
this item as a gauge prior to a network change and then after the change is complete.
If the number goes down, you know that the change has affected your network’s
ability to carry data in a negative way. If the number goes up, the change has
improved your network’s ability to carry data.
You should run the test often to get a “feel” for what your network should read. Once
you know a baseline value for your network, any large change in one direction or
another should give you a reason to investigate.
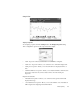
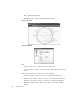
When the mode is active, the test is run every 10 seconds. The test consists of
Observer bursting 70 packets (for Ethernet and Fast Ethernet) or 30 (for Token Ring)
onto the network. The first 10 packets are ignored, but the rest are measured for the
network’s ability to let data flow. Results are displayed in megabits/s.
You cannot start or stop this mode. When the mode is displayed, it is automatically
started. To stop the mode, simply close the mode window. The Efficiency History
display can be viewed in graph, dial, list, 3D, or pie views. There is no setup dialog
for Efficiency History.
Efficiency History can be activated from the main window by selecting
Statistics >
Efficiency History
.
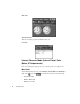
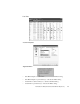
Available Views
•Graph View
• Dial View
• List View