
Specifications

dV-DOSC dV-SUB Manual V3.0 June 2005 66
Optimization Procedure
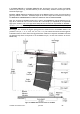
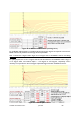
After entering all input data (as described above), press the SCALING button to display the defined
audience geometry and vertical coverage of the system. The cutview display shows the intersection of
individual dV-DOSC enclosure site angles with the audience (square blocks = site angle impacts) and
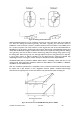
represents the SPL dispersion over the audience. In accordance with WST Condition #4, the best
results are achieved when enclosure site angle impacts have equal spacing between them. In this case,
the SPL decreases by 3 dB when doubling the distance (see Figure 46 for details).
0
5
10
-10-5 0 5 1015202530354045505560
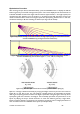
Figure 46 (a): Cutview showing non-constant enclosure site angle impact spacing for an 8 enclosure constant
curvature dV-DOSC array (4.5 degrees between all enclosures)
0
5
10
-10-5 0 5 1015202530354045505560
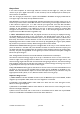
Figure 46 (b): Cutview showing constant enclosure site angle impact spacing for an 8 enclosure variable
curvature dV-DOSC array (inter-enclosure angles = 1, 1, 2, 3, 3.75, 5.5, 7.5 degrees)
Figure 46 (c): Plan view representation of non-constant (a) versus constant spacing (b)
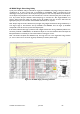
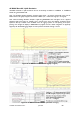
Optimum coverage is obtained iteratively by varying the height of the array and the inter-enclosure
angles (#1 to next, #2 to next, etc). The designer manually performs the optimization by visually
referring to the spacing between enclosure site angle impacts after making changes to the array. Once
equal spacing has been achieved, the designer has successfully optimized the performance of the
system by shaping the array’s vertical isocontour to match the audience geometry. Angle values,
bottom enclosure elevation, site angles for top and bottom enclosures and trim height parameters are
then recorded and used for installation of the system (see Output Data).