
User guide

3–iba_top Fabric Performance Monitor
iba_top TUI Screens
IB0054607-01 A 3-9
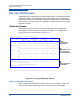
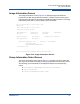
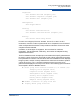
The Bandwidth Statistics screen accepts input commands which specify
parameters to be used in a group focus query, which will provide a list of ports (in
the port group) sorted according to a specified performance criterion. The second
line of the Bandwidth Statistics screen displays the group name, and the currently
selected focus criterion and number of ports for a group focus query. The D
command causes the group focus query to be performed and displayed in a
Group Focus screen. The following input commands are accepted in the
Bandwidth Statistics screen.
C: Select group focus criterion forward (c*) or reverse (C*):
Util-High: Bandwidth Utilization (highest first)
UtlPkt-Hi: Packet Utilization (highest first)
Util-Low: Bandwidth Utilization (lowest first)
Nn: Number of entries n in group focus list
D: Display detail group focus list
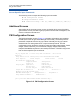
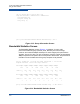
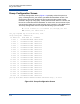
Error Statistics Screen
The Error Statistics screen (Figure 3-15) displays error statistics for a port group
and are divided into up to two subgroups, Internal or External, based on whether a
port's neighbor port is in its group (Internal) or not (External). In the All group all
ports are Internal. In the HCAs and TCAs groups all ports are External. In the SWs
group ports are Internal and External.