
Specifications


RICi-E3, RICi-T3 Ver. 1.0 Monitoring Performance 6-1
Chapter 6
Diagnostics and
Troubleshooting
This chapter describes how to perform the following tasks:
• Monitor the RICi-E3, RICi-T3 performance
• Display statistics
• Perform connectivity tests.
6.1 Monitoring Performance
Interface Statistics
You can display statistic data for the both the Ethernet and E3/T3 ports.
To view the Ethernet statistics:
1. From the Monitoring menu, select Physical Port.
The Physical Port menu appears.
2. From the Physical Port menu, select Ethernet Statistics.
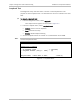
The Ethernet Statistics screen appears as illustrated in
Figure 6-1
.
3. Press <C> to reset the counters or <R> to refresh the screen.
RICi-E3, RICi-T3
Monitoring>Physical Port>Ethernet Statistics
Rx Correct Frames (0)
Rx Correct Octets (0)
Rx FCS Errors (0)
Tx Correct Frames (0)
Tx Correct Octets (0)
Tx Collision (0)
c – Clear Statistics r – Refresh Statistics
>
ESC-prev.menu; !-main menu; &-exit; 1 user(s)
Figure 6-1. Ethernet Statistics