
Specifications


Chapter 6 Diagnostics and Troubleshooting Installation and Operation Manual
6-4 Monitoring Performance RICi-E3, RICi-T3 Ver. 1.0
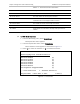
Table 6-3. T3 Statistics Parameters
Parameter Description
Rx Total Frames The total number of frames received.
Rx Total Octets The total number of octets (bytes) received
Rx Total Errors The total number of errors received
Tx Total Frames The total number of frames transmitted.
Tx Total Octets The total number of octets (bytes) transmitted
Tx Total Errors The total number of errors transmitted
Tx Congestion Dropped
Frames
Total number of frames that are discarded due to a lack of buffer space
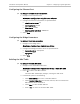
Displaying System Messages
RICi-E3, RICi-T3 maintains a log file, which can hold up to 100 system messages.
All events are time-stamped.
To access the event log:
1. From the System menu, select Log File.
The Log File screen appears as illustrated in
Figure 6-4
.
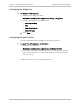
2. In the Log File screen, use the Up and Down keys to scroll the alarm list up
and down.
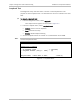
RICi-E3, RICi-T3
Monitoring>System>Log File
Code Description Severity Time
10 LINK_UP: T3 Port Major 0:00:00
10 LINK_UP: Ethernet Port Major 0:00:00
| 40 SNMP_AUTH_FAIL: By address 100.50.24.94 Event 3:57:39
20 LINK_DOWN: T3 Port Major 21:20:45
20 LINK_DOWN: ETH Port Major 0:0:0
>
x - Clear Log File r – Refresh Table
ESC-prev.menu; !-main menu; &-exit; ?-help 1 user(s)
Figure 6-4. Log File