
System information


Chapter 2 Agent Configuration Mode RADview-PC/TDM Megaplex-2100/2104 User’s Manual
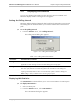
If Statistics polling is enabled (see Setting the Polling Interval), RADview updates
the data in the Current Data dialog box after each polling interval.
Displaying a Current Data Graph
The Current Data Graph is only applicable to MTML-2 ports in which:
• Active Status = Online or Online Redundancy
• Line Type = ESF (MTML-2/T1, MTML-F/T1) or Line Type = G.732NCRC or
G.732SCRC (MTML-2/E1. MTML-F/E1)
To display the current data in graph format:
• From the Statistics menu, select Current Data followed by Graph…
The Current Graph dialog box appears.
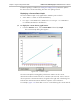
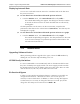
Figure 2-61. Current Graph
The Current Graph shows Megaplex performance statistics in the current
measurement interval. Each interval is 15 minutes (900 seconds). Lines of various
colors represent a measurement item. A legend on the right side of the dialog box
indicates the measurement items and their respective color indications.
For example, Figure 2-61 shows that no errors occurred during the current interval.
2-78 Displaying Port Statistics