
System information


RADview-PC/TDM Megaplex-2100/2104 User’s Manual Chapter 2 Agent Configuration Mode
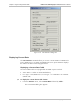
Table 2-46. Current Graph Parameters
Parameter Possible Values / Remarks
ESs Errored Seconds. Number of seconds in the current interval in which an event or alarm
occurred
SESs Severe Errored Seconds. Number of seconds in the current interval in which at least 320 CRC
events or one OOF event occurred
UASs Unavailable Seconds. Number of seconds in the current interval in which a failed signal state
exists. A failed signal state occurs after 10 consecutive severe errored seconds. This state is
cleared only after the Megaplex processes 10 consecutive seconds of data without an SES
CSSs Controlled Slip Seconds. Number of seconds in the current interval in which at least one
controlled SLIP event occurred
BESs Bursty Errored Seconds. Number of seconds in the current interval in which 2 - 319 CRC
events occurred
DMs Degraded Minutes. Number of minutes in the current interval in which the bit error rate (BER)
exceeded 1x10
-
6
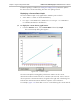
The horizontal axis indicates the time elapsed (in seconds) since the beginning of
the current measurement interval. When a new interval begins, RADview displays
a new graph.
The vertical axis indicates the various values of the measurements. The origin of
the axis represents 0. The highest point represents the maximum value of the
measurements (maximum = 899).
View Overlap
In some cases, various lines on the graph may indicate identical values. The View
Overlap function allows you to see all the lines on the graph, regardless. If View
Overlap is disabled, only one of the lines indicating an identical value is seen.
To activate the View Overlap function:
• Click the View Overlap checkbox so that x appears.
You can now see all the lines on the graph, even if some indicate identical values.
Displaying Port Statistics 2-79