
Specifications


Installation and Operation Manual Chapter 5 Monitoring and Diagnostics
Optimux-108 Ver. 6.1 Handling Events 5-9
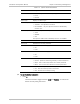
Alarm
The list of traps is given in
Table
5-6
.
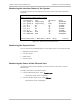
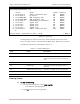
Table
5-6. Trap List
Trap Description OID
coldStart The unit has been restarted 1.3.6.1.6.3.1.1.5.1
authenticationFailure User authentication has failed 1.3.6.1.6.3.1.1.5.5
linkDown An uplink, tributary or user port has been disconnected 1.3.6.1.6.3.1.1.5.3
linkUp An uplink, tributary or user port has been connected 1.3.6.1.6.3.1.1.5.4
tftpStatusChangeTrap TFTP session status has changed 1.3.6.1.4.1.164.6.1.0.1
agnStatusChangeTrap SNMP agent status has changed 1.3.6.1.4.1.164.6.1.0.2
optMxConfigChange Status of one of the PS has changed 1.3.6.1.4.1.164.3.5.0.1
optMxAgentFault
Status of local-remote device connection has changed 1.3.6.1.4.1.164.3.5.0.2
optLineStatusChange
Status of uplink or E1 tributary links has changed 1.3.6.1.4.1.164.3.5.0.3
dacsMuxAlarmsTrap An alarm occurred in the system 1.3.6.1.4.1.164.3.3.0.2
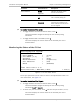
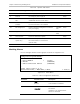
5.3 Handling Events
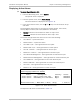
Displaying Events
The Event log displays up to 200 events. When the event log buffer is full, each
new event replaces the currently oldest event.
³ To access the event log:
1. From the Monitoring menu, select System.
The System menu is displayed.
2. From the System menu, select Event Log.
The Event Log is displayed (see
Figure
5-9
).
3. In the Event Log screen, use the U and D keys to scroll the alarm list up and
down.