
User's Manual


116 Chapter 6. Red Hat Network Website
6.9.1. Probe Status —
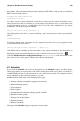
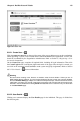
As shown in Figure 6-9, the Probe Status page is shown by default when you click Monitoring in
the top navigation bar.
Figure 6-9. Probe Status
The Probe Status page displays the summary count of probes in the various states and provides a
simple interface to find problematic probes quickly. Please note the probe totals in the tabs at the top
of the page may not match the numbers of probes displayed in the tables below. The counts at the
top include probes for all systems in your organization, while the tables display probes on only those
systems to which you have access, through the System Group Administrator role. Also, the probe
counts displayed here may be out of sync by as much as one minute.
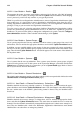
The following list describes each state and identifies the icons associated with them:
•
— Critical - The probe has crossed a CRITICAL threshold.
• — Warning - The probe has crossed a WARNING threshold.
• — Unknown - The probe is not able to accurately report metric or state data.
•
— Pending - The probe has been scheduled but has not yet run or is unable to run.
• — OK - The probe is running successfully.