
Operating instructions


RF Technology PA501 Page 19
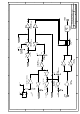
A ENGINEERING DIAGRAMS
2. Record serial number, etc., on the rest report sheet.
3. Inspect the module. Check the disposition of flying cables (clear of RF power
components).
4. Switch the Generator output level to 3dBm (LEVEL 3 dBm/enter). Adjust C43,
44, 11, 12, 35 for output power of at least 100W on the power meter. Switch off
the generator (LEVEL OFF). The purpose of this step is simply to get the
adjustments approximately correct before moving to the swept alignment stage.
5. Remove the power meter and connect the spectrum analyser to the output of the
attenuator. Remove the SMG and connect the tracking generator. Set the
tracking generator output to 0dBm. Set the S.A. to a centre frequency of
485MHz and 10MHz/division. Set the reference level to 10dBm, and adjust the
display for 2dB/div. Check that spectrum analyser “time/div” and “Res. Bw” are
set to automatic. Adjust C43, C44, C11, C12 and C35 for flat response, as high as
possible on the display (i.e. remove small notches in the trace).
There should be
less than 1 division of ripple for 3 divisions either side of the centre, preferably
3.5 to 4 divisions. Disconnect the tracking generator and the S.A.
6. With the equipment set up as it was for the measurement of power at 500MHz,
and the generator output enabled, adjust the supply voltage to obtain 13.5 ± 0.25V
dc on the inside connections of the 25-pin D-shell power connector.
7. With the equipment still set up for the measurement of power at 500MHz, using
the HP power meter and the R&S generator, start the PwrView program. (You
may use the command script ViewPA501, or the direct command “pwrview 450e6
512e6”.) You should see a simple ASCII screen with two columns of numbers at
the left, and an array of characters forming a horizontal bar graph across the rest
of the screen. The graph will refresh about every 3 seconds.
The display will have a horizontal row of characters for each frequency. At left,
the frequency and power in MHz and Watts is printed, followed by groups of
symbols. The symbol changes for power less that 100W, more than 100W but
less than 120W, and more than 120W. With 15W drive, the power may well
exceed 150W for all frequencies between 450MHz and 512MHz. Satisfactory
performance consists of power above 125W at the required operating frequency,
above 120W from 450-512MHz.
When met, this can be recorded by printing one screen of data. This is
conveniently achieved using the PrintPA501 script (batch file). Record the DUT
serial number on the printout, and attach this to the test report sheets.
8. Set the RF generator to the frequency at which the greatest power was recorded in
the PwrView test. Switch the generator on, reconfirm the RF power level.
Measure and record the supply current, which should be below 30A.
9. Adjust the FWDPWR pot (RV2) to obtain the desired output power, or an output
power of 120W if this is not specified, at the intended operating frequency, or
500MHz if this is not known. (ie.120W at 500MHz is the default alignment