
User manual


RIGOL Chapter 3 To Set the Horizontal System
3-6 MSO2000A/DS2000A User’s Guide
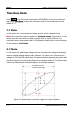
4. Observe the measurement result shown in the figure above. According to the
measurement schematic diagram of the phase deviation (as shown in Figure
3-2
), A/B (C/D) = 1. Thus, the phase deviation angle θ=±arcsin1=90°.
Note:
The maximum sample rate of X-Y mode is 1.0 GSa/s. Generally, longer sample
waveform can ensure better display effect of Lissajous figure. But due to the
limitation of the memory depth, you have to reduce the waveform sample rate
to acquire longer waveform (refer to the introduction in “Memory Depth”).
Therefore, during the measurement, reducing the sample rate properly can
acquire better display effect of Lissajous figure.
When X-Y mode is enabled, “Delayed Sweep” will be disabled automatically.
The following functions are not available in X-Y mode:
“Auto Measurement”, “Math Operation”, “Reference Waveform”,
“Delayed Sweep”, “Vectors”, “horizontal position”, “To Trigger the
Oscilloscope”, “Protocol Decoding”, “Acquisition Mode”, “Pass/Fail
Test”, “Waveform Record” and “Digital Channel
”.
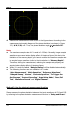
Method 2: Use the shortcut measurement function
Please measure the phase deviation between the input waveforms of CH1 and CH2
by referring to the phase deviation measurement function in “Delay and Phase”.