
Instructions

RIGOL Chapter 3 Functions of the Front Panel of RTSA
3-20 RSA3000E User Guide
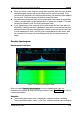
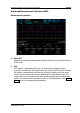
Spectrogram
Measurement Interface:
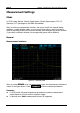
Figure 3-4 Spectrogram View
After you select Spectrogram to be the measurement type, the measurement
interface is shown in the figure above. Press Meas Setup to set the relevant
parameters.
Remarks:
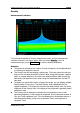
The Spectrogram view is displayed in multiple windows, including displaying the
conventional Normal view. In this view, the multiple windows have a coupling
relationship. The conventional Normal view displays the specified spectral line
set by the trace parameters. Select the Normal view, Limit measurement
function is supported. In the Spectrogram view, a white horizontal line
represents the currently displayed trace. In the Spectrogram mode, display trace
1 indicates the latest trace.
In the view, each horizontal line represents a trace, and the vertical Y-axis
represents time. The latest trace data is displayed at the top of the Spectrogram
by default, and the historical traces are moved up one position. The
Spectrogram can hold 8,192 traces. When Spectrogram occupies a Window that
has full vertical size, 486 traces can be displayed at one time. When
Spectrogram occupies the vertical window in the lower section, 230 traces can
be displayed at one time.
In the view, the colors represent signal amplitude. The color bar is displayed at
the far left of the Spectrogram view. For details about the settings of the color
bar, refer to "Ref Hue".