
Information


EMI Pre-Compliance Guide RIGOL Technologies
RIGOL Technologies CO., LTD. 09.09.2021
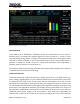
Additionally to EMI analysis the frequency band can be analyzed in real time [RT] as well.
This mode uses a very fast FFT algorithm to calculate the frequency spectrum. The calculation
time is smaller than one FFT frame. Therefore a seamless capture of time signal is possible
and no signal information
7
will be lost. In RT mode different displays can be used. For
example within density mode it is possible, to see a signal repetition over test time in
different color grades and therefore it’s possible to see more details. Density or Normal view
could be combined with spectrogram (time waterfall over frequency range) where different
amplitude values are displayed in diverse color grades (see figure 8).
7
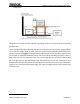
POI: 7,45 µsec @40 MHz RTBW
Figure 7: Conducted emission test (acc. to EN55022, Class B) for a power supply of an ITE device