
User Manual, Firmware rev. 3.0 or LATER Owner's manual

156 Publication 1404-UM001F-EN-P - November 2009
Chapter 7 Data Logging
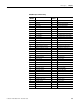
The Min/Max Log Results table is a read-only data table consisting of
11 floating-point elements containing the following information:
• Parameter #: See the Min/Max Log Parameter Listing
table above
• Min and max values
• Timestamps: for Min and Max values in four-element timestamp
format
Time-of-use
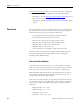
The power monitor provides a Time-of-Use Log. Also called the TOU
log, it provides a one-year time-of-use history of energy usage and
demand. The time-of-use log provides the following:
• User-selectable on-peak, mid-peak and off-peak hours
• User-selectable off-peak days of the week
• Real, reactive and apparent energy usage records
• Real, reactive and apparent power demand records
• Month-to-date record for the current month
• Monthly history for the past year
• User-selectable day of month to begin time-of-use logs
The time-of-use log is designed to support simple billing and cost
allocation applications that apply different rates to energy and
demand used at different times.
Time-of-use Hours Selection
Off peak hours are those which occur on off peak days or during
hours not selected as either mid peak or on peak. Hours selected as
both mid peak and on peak will be evaluated as on peak hours.
RSEnergyMetrix software selects the appropriate time-of-use logs to
store energy and demand values based on the time-of-use hours
selection and the off peak day selection.
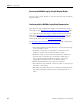
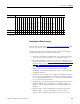
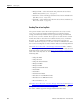
Time-of-use selection elements are bit mapped parameters. The bits
are mapped as shown in the table below, which depicts the default
values as an example. The default time-of-use periods include the
following:
• Mid peak AM – 8:00…10:59
• Mid peak PM – 3:00…6:59
• Peak AM – 10:00…11:59
• Peak PM – 12:00 noon…2:59