
Manual

166 Rockwell Automation Publication 1407-UM001G-EN-P - April 2013
Appendix A Time Over-current Characteristic Curves
Time Over-current
Characteristic Curve
Graphs
The following illustrations show the characteristic curves of the CGCM.
Equivalent time dial settings were calculated at a value of five times pickup.
The Characteristic Curve Cross-Reference
table cross-references each curve to
existing electromechanical relay characteristics.
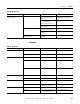
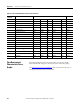
Table 34 - 51P and 51N Time Characteristic Curve Constants
Curve
Selection
Curve Name Trip Characteristic Constants Reset
ABCN KR
1 S, Short Inverse 0.2663 0.03393 1.000 1.2969 0.028 0.5000
2 S2, Short Inverse 0.0286 0.02080 1.000 0.9844 0.028 0.0940
3 L1, Long Inverse 5.6143 2.18592 1.000 1.000 0.028 15.750
4 L2, Long Inverse 2.3955 0.00000 1.000 0.3125 0.028 7.8001
5 D, Definite Time 0.4797 0.21359 1.000 1.5625 0.028 0.8750
6 M, Moderately Inverse 0.3022 0.12840 1.000 0.5000 0.028 1.7500
7 I, Inverse Time 8.9341 0.17966 1.000 2.0938 0.028 9.0000
8 Inverse Time 0.2747 0.10426 1.000 0.4375 0.028 0.8868
9 V, Very Inverse 5.4678 0.10814 1.000 2.0469 0.028 5.5000
10 V2, Very Inverse 4.4309 0.09910 1.000 1.9531 0.028 5.8231
11 Extremely Inverse 7.7624 0.02758 1.000 2.0938 0.028 7.7500
12 E2, Extremely Inverse 4.9883 0.01290 1.000 2.0469 0.028 4.7742
13 Standard Inverse 0.01414 0.00000 1.000 0.0200 0.028 2.0000
14
B, Very Inverse (I
2
t)
1.4636 0.00000 1.000 1.0469 0.028 3.2500
15
Extremely Inverse (I
2
t)
8.2506 0.00000 1.000 2.0469 0.028 8.0000
16
Long Time Inverse (I
2
t)
12.1212 0.00000 1.000 1.0000 0.028 29.0000
17 Fixed Time 0.0000 1.00000 1.000 0.0000 0.028 1.0000