
User guide


Chapter 9
Configuring Online Communication
9–6
Diagnostics
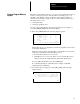
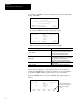
1. To monitor the diagnostics of the network or the selected node, press
[F1], DIAGNSTC from the Who display. The following display appears:
Node Addr. Device Max Addr./Owner
2 5/02 (31)
3 500–20 (31)
4 5/01 (31)
0 APS (31)
Node Addr: 2 Baud Rate: 19200
F1 F2 F3 F4 F5
NODE
OFL
NETWORK
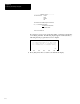
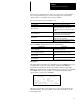
2. To monitor the diagnostic display of the selected node press [F1], NODE.
The following display appears:
Node: 2 Device Type: 5/02
Firmware Rel: 5 Series: C
Mode: PRG
Fault Code: 0000H
Program Name 1000
Forces: Not Installed
F1 F2 F3 F4 F5
OFL
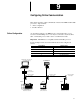
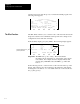
3. To monitor the diagnostic display of the network press [ESC], then
[F5], NETWORK.
The following display appears:
Total Nodes: 5 Max. Addr.: 31
Msgs Sent: 29736 Msgs Rcvd: 202
Retries: 0 Limit Exceeded: 0
Bad Msgs Rcvd: 0
NAK Sent: 0 NAK Rcvd: 0
Node Addr: 2
F1 F2 F3 F4 F5
OFL
RESET
4. From this display, you can reset the messages sent and messages received
counters by pressing
[F5], RESET.
5. Press
[ESC] twice to return to the Who menu.