
User manual


Waveform Analysis
R&S
®
Scope Rider RTH
89User Manual 1326.1578.02 ─ 04
3.5.2.2 Waveform Data Files
The waveform data files are indicated by *Wfm.* in the file name. They contain the
actual waveform data, the Y-values of the samples. Mostly, the Y-values are voltages:
Y0; Y1; Y2; Y3; ...
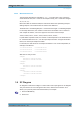
Before and after the waveform data, the instrument writes some presettling and post-
settling samples. The overall number of values in the data file is:
ValuesNumber = PreSettlingSamples + HorizontalTraceLength + PostSettlingSamples
For envelope waveforms, the number of values in the file doubles. Two Y-values for
each sample are written, one for the upper and one for the lower envelope:
Ymin0; Ymax0; Ymin1; Ymax1; Ymin2; Ymax2; Ymin3; Ymax3;...
In peak detect acquisition mode, the number of values depends on the decimation fac-
tor. If the decimation factor is 1, one value per sample is written. At higher decimation
factors, two values per sample are written.
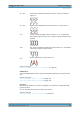
In CSV files, the data values of one sample are written in one row. Envelope data, for
example, looks like this:
-0.0125490196078431 -0.0619607843137255
-0.0133333333333333 -0.0627450980392157
-0.0149019607843137 -0.0650980392156863
XML files are easy to read:
<sample>
<datamax>-0.012549</datamax>
<datamin>-0.0619608</datamin>
</sample>
<sample>
<datamax>-0.0133333</datamax>
<datamin>-0.0627451</datamin>
</sample>
<sample>
<datamax>-0.014902</datamax>
<datamin>-0.065098</datamin>
</sample>
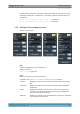
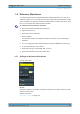
3.6 XY-Diagram
XY-diagrams combine the voltage or current levels of two input signals in one diagram.
They use the level of a second signal as the x-axis, rather than a time base. This
allows you to perform phase shift measurements, for example.
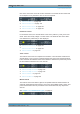
1. Press the MODE key.
2. Select "XY".
XY-Diagram