
Datasheet


Rohde & Schwarz R&S®HMC8015 PowerAnalyzer 5
Inrush function.
Harmonic analysis: bargraph. Harmonic analysis: tabular display.
Waveform function: load with phase‑angle control. Trend chart function.
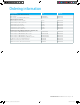
Harmonic analysis
Harmonic analysis can be displayed in a table or
graph or even logarithmically for better readability. The
bargraph can optionally show up to the 50th harmonic
of voltage and/or current. The bargraph shows the am‑
plitude of the harmonic selected with the cursor.
Waveform function
The waveform function shows the voltage, current and
power of an input signal period over time. The example
shows a load with phase‑angle control.
Trend chart function
The trend chart function makes it possible to observe
longer periods of time and can be displayed on up to
two channels. 15selectable measurands are available,
e.g. U, I, P, S, Q, F. The y‑axis is scaled in line with prog‑
ress. The time axis can be varied from 5s/div to
10min/div.
HMC8015_bro_en_3607-3374_12_v0100.indd 5 09.02.2016 11:43:52