
User's Manual
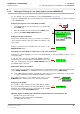
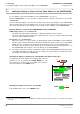
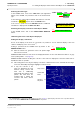
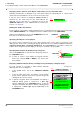

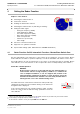

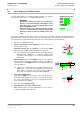
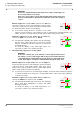
Table Of Contents
- General Safety Precautions
- List of Contents
- 1 Overview
- 2 Basic Settings; General Remarks about Operating
- 3 PPI Settings
- 3.1 Screen Stabilisation of the PPI: True Motion, Relative Motion
- 3.2 PPI Orientation: Head-Up, North-Up, Course-Up
- 3.3 Centering / Off-Centering of the Display (Center, Off-Center)
- 3.4 Range Selection (Range)
- 3.5 Range Rings, Grid
- 3.6 Own Ship Symbols and Target Symbols, Vectors, Past Position Plots
- 3.7 Trails
- 3.8 Setting the Display of Pre-planned Tracks
- 3.9 Defining the System Track and the Next Waypoint; System Track Display
- 3.10 Setting the Display of User Chart Objects on the RADARPILOT
- 3.11 Setting the Display of Charts and User Chart Objects on the CHARTRADAR
- 3.12 Setting the Display of the Map
- 3.13 Adjusting the Chart or Map to the Radar Video
- 4 Setting the Radar Function
- 4.1 Radar Function On/Off, Interswitch Functions, Master/Slave Switch-Over
- 4.2 Basic Setting of the Radar Video
- 4.3 Selection of the Antenna Revolution Rate
- 4.4 Radar Setting for High Speed of Own Vessel (HSC)
- 4.5 Radar Setting for the Display of RACON Codes
- 4.6 Radar Setting for SART Detection (X-Band only)
- 4.7 Suppression of the Synthetics and Video
- 5 Heading, Speed, Position
- 6 Bearing and Range
- 7 ARPA Functions
- 7.1 Symbols Used
- 7.2 Procedure of the Target Acquisition
- 7.3 Manual Target Acquisition
- 7.4 Automatic Target Acquisition; Settings of the Acquisition/Guard Zone
- 7.5 Deletion of Targets, Loss of Target
- 7.6 Target Data Display
- 7.7 Target Labels
- 7.8 Selecting the Reference Targets for Reference Target Tracking
- 8 EPA Functions (Electronic Plotting Aid)
- 9 Collision Avoidance (TCPA, CPA)
- 10 Trial Manoeuvres
- 11 Editing of Pre-planned Tracks
- 12 Editing the Map
- 13 Displays in the Multidisplay
- 14 Quick Info Box
- 15 Evaluation of the Radar Video
- 16 The Radar Keyboard
- 17 Alarm Management
- 18 List of Alarms
- 19 List of the Alarm Signal Outputs
- 20 Care and Maintenance Work
- 21 Performance Monitor
- 22 System Maintenance Manager
- 22.1 Determining the Versions of Software, Hardware and Documentation
- 22.2 Listing the System Faults
- 22.3 Off-Line Selfcheck
- 22.4 Checking / Correcting the Computer Time
- 22.5 Distribution and Deletion of Map Data; Data Saving
- 22.6 Exchanging Track Files between the Indicators; Data Saving
- 22.7 The Handling of Diskettes
- 22.8 Aborting and Restarting the Program of the Radar System

ED 3038 G 232 / 01 (2002-06)
Operating Instructions
3 PPI Settings
3.10 Setting the Display of User Chart Objects on the RADARPILOT
b_r1_e21.fm / 21.06.02
41
RADARPILOT / CHARTRADAR
3.10 Setting the Display of User Chart Objects on the RADARPILOT
☞ For display of the User Chart Objects on the CHARTRADAR, see page 42.
If there is a CHARTPILOT, the User Chart Objects that exist in the CHARTPILOT can also be displayed
on the RADARPILOT.
Switching the Display of User Chart Objects On/Off
1. Chart Display Mode must be switched on, e.g. by pressing
the CHART key.
2. Open the CHART menu by clicking on the CHART button.
3. Click on the USER CHART OBJECTS button.
Setting the Display of the Areas
As far as the display of the areas is concerned, it is possible to
choose between display of the area outlines and display of the
area colours.
Setting is performed in the CHART menu by means of the
AREAS FILLED button.
Displaying User Chart Objects Temporarily on Top of the Radar Video
Normally, the video is displayed on top of the User Chart Objects, i.e. User Chart Objects can be covered
over by the video.
If only the area contours are displayed (AREAS FILLED is
switched off), the User Chart Objects are displayed on top of the
video (i.e. completely) as long as the VIDEO ON TOP button in
the CHART menu is pressed.
Defining the Symbol Presentation
For the symbols, it is possible to define whether they are to be displayed in the same way as in the paper
charts (PAPER CHARTS) or in a simplified form more suitable for the screen (SIMPLIFIED).
☞ In the SIMPLIFIED presentation, the symbols consist only of contours, and therefore cover the video
to a lesser extent than with the PAPER CHARTS presentation.
The setting procedure: In the CHART menu, click on the
SYMBOLS button and then click on the desired presentation.
Switching Texts On/Off
It is possible to define whether the User Chart Objects designa-
tions (entered during editing of the User Chart Objects) can be
displayed. This definition process is performed in the CHART
menu by means of the TEXT LABELS button.
Optimum Setting for Radar Video Observation with the Electronic Chart Switched On
- Display of the area contours only
- Setting the symbol presentation to SIMPLIFIED
- No display of Text Labels
CHART
2.DO
3.DO
CHART
USER CHART OBJECTS
SIMPLIFIED
SYMBOLS
TEXT LABELS
AREAS FILLED
VIDEO ON TOP
DO
AREAS FILLED
DO
VIDEO ON TOP
SYMBOLS
DO
PAPER CHART
SIMPLIFIED
SIMPLIFIED
DO
TEXT LABELS