POWER QUALITY AND REVENUE METER EM920 Operation Manual BG0482 Rev.
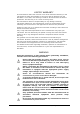
LIMITED WARRANTY The manufacturer offers the customer a 24-month functional warranty on the instrument for faulty workmanship or parts from date of dispatch from the distributor. In all cases, this warranty is valid for 36 months from the date of production. This warranty is on a return to factory basis. The manufacturer does not accept liability for any damage caused by instrument malfunction.
Do not use the instrument for primary protection functions where failure of the device can cause fire, injury or death. The instrument can only be used for secondary protection if needed. Read this manual thoroughly before connecting the device to the current carrying circuits. During operation of the device, hazardous voltages are present on input terminals. Failure to observe precautions can result in serious or even fatal injury or damage to equipment.
Table of Contents Chapter 1 Introduction ............................................................... 8 Chapter 2 Operating the EM920................................................ 14 Meter Assembly ....................................................................................... 14 Controls and Indicators ........................................................................... 15 TEST Mode ...............................................................................................
Setup Menus and Access Rights ............................................................... 49 Viewing and Changing Setup Options ....................................................... 50 Chapter 4 Using PAS Software.................................................. 52 Software Installation ............................................................................... 52 Installing PAS........................................................................................
EN50160 Advanced Setup......................................................................125 Clearing EN50160 Evaluation Counters ....................................................126 Configuring Communication Protocols................................................... 127 Configuring Modbus ..............................................................................127 Configuring DNP3 .................................................................................128 Configuring Meter Passwords .
Appendix A Parameters for Monitoring and Logging .............. 183 Appendix B Setpoint Parameters ............................................ 201 Appendix C Analog Output Parameters .................................. 202 Appendix D Billing and Load Profile Log Files ......................... 204 Appendix E EN50160 Statistics Log Files ................................ 208 Appendix F EN50160 Evaluation and Recording ..................... 214 EN50160 Background ...................................
Chapter 1 Introduction Chapter 1 Introduction The eXpertmeter™ EM920 The EM920 is especially designed for utility, industrial and commercial billing metering with high requirements to reliability of power quality monitoring and availability of the device.
Chapter 1 Introduction Meter Features Billing/TOU • Accuracy class 0.2 ANSI C12.20 (current class 10 and 20) active energy and class 0.
Chapter 1 Introduction harmonic and interharmonic voltage, mains signaling voltage • High-voltage fast transient recorder; impulsive and low frequency oscillatory transient overvoltages with peaks up to 2kV and durations from 20 microseconds • Ready-for-use compliance statistics reports with the supplementary software Fault Recorder • Digital Fault recorder: three voltage and three/four current channels, up to 10 external digital triggers for monitoring circuit breakers and protection relays; onboard o
Chapter 1 Introduction RMS envelopes; up to 20 pre-fault and post-fault cycles Programmable Logical Controller • Embedded Programmable Controller: 16 control setpoints • OR/AND logic, extensive triggers, programmable thresholds and delays, relay control, event-driven data recording • 8 digital counters for counting pulses from external sources and internal events • 4 programmable timers from 1 cycle to 24 hours for periodic recording and triggering operations on a time basis.
Chapter 1 Introduction • 4AO analog output module with 0-1mA, +/-1mA, 020mA and 4-20mA current output options Memory • 16 Mbyte flash memory for long-term billing, event, waveform and data recording Standard Communications • Front ANSI C12.18 optical serial communication port (Modbus RTU/ASCII and DNP3 protocols) • Embedded serial RS-485 port (Modbus RTU/ASCII and DNP3 protocols) • Full speed USB 1.
Chapter 1 Introduction Meter Nameplate FM CL CA Kh V W Freq TA - FORM designation - Current class - Accuracy class - Watthour meter constant - Rated voltage - Wiring configuration - Working frequency - Test amperes Multifunction Meter LIFT FM 9S CL 20 CA 0.2 Kh 0.25 V~ 57-120 W 4WY F OR BAT TERY Freq 50/60Hz TA 2.5 EM920 TEST S/N 123456789 SCROLL Meter serial number CTR :5 VTR SELECT/ENTER DMDRESET :1 Mult.
Chapter 2 Operating the EM920 Meter Assembly Chapter 2 Operating the EM920 Meter Assembly The meter view with a removed cover and the location of the expansion slots and lithium battery are shown in the following pictures.
Chapter 2 Operating the EM920 Controls and Indicators WATT – watthour pulse LED VAR – varhour pulse LED LCD graphic display Location of the replaceable battery IR optical port TEST button (under cover) DEMAND RESET button SELECT/ENTER button SCROLL button Controls and Indicators Push Buttons The EM920 has four push buttons that allow you to control meter operations, scroll through the multi-page display screens for local meter reading and inspect or change meter setup parameters.
Chapter 2 Operating the EM920 TEST Mode Rated Voltage, V Secondary Current, A Kh, Wh/imp Pulse Rate, imp/kWh 120-277 1 0.08 12,500 120-277 5 0.40 2,500 The LED pulse rate in TEST mode is user-programmable. The factory set defaults and available ranges are shown in the following table. Rated Voltage, V Secondary Current, A Default Pulse Rate, Wh/imp (imp/kWh) Range, Wh/imp (imp/kWh) 57-120 1 0.05 (20,000) 0.01-0.05 (20,000-100,000) 57-120 5 0.10 (10,000) 0.01-0.
Chapter 2 Operating the EM920 Device Diagnostics Device Diagnostics Device diagnostic messages may appear as a result of the EM920 built-in diagnostic tests performed during start-up and device operation. A blinking diagnostics indicator is shown on the display whenever there are diagnostic messages. See Status Indicators in Chapter 3 for information on diagnostics indicators. See Device Diagnostics Display in Chapter 3 on how to inspect the meter diagnostics messages from the display.
Chapter 2 Operating the EM920 Meter Clock and Time Synchronization permits clearing the billing data registers and billing data profile files (see Clearing Billing Data). The following table shows the meter security levels and user access rights. Password Security Level Password 1 Low Password 2 Medium Password 3 High (Administration level) Access Rights Reset of billing and engineering maximum demands, and device diagnostics. Meter clock update. Display setup. TEST mode.
Chapter 2 Operating the EM920 Monitoring the Meter Battery Monitoring the Meter Battery A backup lithium battery keeps the meter clock running when the power is removed from the meter. You can monitor the status of the battery from the front display on the Device Info pages (see Device Info Display in Chapter 3) and via the device diagnostics.
Chapter 2 Operating the EM920 Billing and Energy Metering Energy Counters The EM920 provides instrumentation energy and billing energy metering. Both use the same energy measurement circuitry as a source input for accumulation energies but operate independently. Energy counters have a nine-digit kWh resolution with one decimal place by default. You can set the energy counters to have fewer digits by changing the default energy roll value in your meter (see Device Options and Mode Control in Chapter 5).
Chapter 2 Operating the EM920 Instrumentation Metering The present tariff rate is indicated on the EM920 display. If required, tariff-switching pulses with a programmable duration can be output via the meter relays. End of Billing The meter can be configured to trigger a reset of billing maximum demands and an end of billing period automatically on a monthly schedule, manually via the sealable DEMAND RESET button, and remotely via communications.
Chapter 2 Operating the EM920 Demand Forgiveness (Cold Load Pickup) Voltage and current harmonic measurements are based on 10-cycle/50Hz or 12-cycle/60Hz waveforms (per IEC 61000-4-7), sampled at a rate of 128 samples/cycle. The EM920 uses dynamic sampling techniques to maintain a steady sampling rate and avoid instrumentation errors when the line frequency changes. The meter provides short and measurements as per IEC 61000-4-15.
Chapter 2 Operating the EM920 Power Transformer/Line Loss Compensation The EM920 is able to calculate the transformer errors dynamically based on the transformer performance characteristics and the actual CT current and PT voltage signals appearing at the meter, to interpolate to the actual measured operating point and to apply the interpolated error corrections to the meter calculations.
Chapter 2 Operating the EM920 Operating Digital Inputs Operating Digital Inputs The EM920 can monitor a total of 10 digital inputs including two fast internal digital inputs and 8 inputs found on the 8DI expansion module. See the EM920 Installation Manual for digital input ratings and connection diagrams. Fast internal digital inputs are sampled at a 1-ms rate, and expansion inputs are sampled at a 1/2-cycle rate.
Chapter 2 Operating the EM920 Operating Analog Outputs Each relay can be operated either locally from a setpoint in response to an internal or external event, remote command sent through communications, or directly linked to an internal pulse source producing or interval pulses. control or by a can be energy See Configuring Relay Outputs in Chapter 5 on how to configure relay outputs in your meter. See Using Control Setpoints in Chapter 5 on how to operate relay outputs via setpoints.
Chapter 2 Operating the EM920 Operating the Fast Transient Recorder reports, and long-term harmonics survey statistics for trouble-shooting harmonic problems throughout an electrical network. It also records time-tagged voltage disturbances and voltage fault events into the Power Quality event log. All power quality triggers have programmable thresholds and can be adjusted for a specific application.
Chapter 2 Operating the EM920 Communicating with the EM920 trigger the Data recorder for fast profiling of RMS voltages and currents during a fault. See Configuring the Fault Recorder in Chapter 5 for more information on operation of the Fault recorder. Communicating with the EM920 Communication with the EM920 is provided either via the embedded optical IR and RS-485 ports, or via the expansion communication ports.
Chapter 2 Operating the EM920 Communicating with the EM920 You can check the Ethernet port MAC address and present IP address setting via the Device Info display (see Device Info Display in Chapter 3). See Setting Up the Ethernet in Chapter 5 on how to configure your Ethernet port. The meter provides two TCP servers configured for the Modbus/TCP (port 502) and DNP3.0/TCP (port 20000) protocols. The TCP servers support 5 simultaneous Internet connections with client applications.
Chapter 2 Operating the EM920 Auxiliary AC/DC Backup Power Supply network. When client operation is enabled, it automatically readdresses network connections to the GPRS port if the GPRS module is installed. NOTE When either Ethernet or GPRS network parameters are changed, the meter logs out of the network so the IP address you might use for connecting to the meter will no longer be effective. Check the meter for a new GPRS IP address either from the front display, or via PAS.
Chapter 3 Using Front Display Display Operations Chapter 3 Using Front Display TEST DEMAND RESET SCROLL SELECT/ENTER Display Operations The EM920 has a high-contrast graphical LCD display with backlight for local data read outs, meter setup and servicing. The display operates in two modes: • Multi-page data display mode with Auto-Scroll feature allows you to scroll through display screens and pages to view various billing, instrumentation and status data.
Chapter 3 Using Front Display Display Operations The function of each button changes depending on what operating mode the display is in. The SCROLL button operates once it’s briefly pressed. It has two functions: • In data display mode, it scrolls through the display pages. • In programming mode, it scrolls through the menu items and allows changing a selected digit when entering numbers. The SELECT/ENTER button normally operates once it’s released.
Chapter 3 Using Front Display Display Operations The TEST Button The TEST button can be accessed by removing a meter cover. Pressing the TEST button for more than 2 seconds moves you to the test mode menu where you can switch the operating mode or change the test LED pulse rate. See TEST Mode in Chapter 2 for more information on TEST mode operations. Navigating in Data Display Mode The following table gives a summary of the button operations in data display mode.
Chapter 3 Using Front Display Display Operations Status Indicators Graphical icons on the bottom status bar give immediate meter status indication and show the present tariff rate. The present date and time are indicated at left on the status bar. The date order can be changed according to local rules via the Local Settings setup.
Chapter 3 Using Front Display Display Operations Indicator Icon Event Priority Description Low General diagnostic message indicator: indicates that there are diagnostic messages you can inspect via the DIAGNOSTICS display. The icon is shut down after you explicitly reset diagnostics messages either from the display or via communications (see Clearing Device Diagnostics). You can disable diagnostic message indicator via the Display Setup menu (see Display Setup).
Chapter 3 Using Front Display Display Operations minutes. You can temporarily set the backlight to continuous operation if you need to work in dark for more time. Auto-Return If the Auto-Return feature is enabled and no button is pressed for the programmable Auto-Return interval (1 to 30 minutes for data displays; fixed at 5 minutes for setup menus), the display automatically returns to the default page from any other data display or a setup menu.
Chapter 3 Using Front Display Data Displays Data Displays The EM920 has 12 multi-page data displays listed in the following table. Display Number Display Label Display Contents 1 BILL 0 2 BILL 1 Present (0) billing period data Last (-1) billing period data 3 BILL 2 Second previous (-2) billing period data 4 BILL 3 Third previous (-3) billing period data 5 MAX.
Chapter 3 Using Front Display Data Displays Each billing period display lists all total and tariff energy, maximum demand and cumulative maximum demand registers for all configured billing registers and all active tariffs. The EM920 automatically arranges pages in each display. Only registers you selected in the billing/TOU register setup and tariff rates listed in the TOU daily profiles are included (see Configuring Billing/Tariff Registers and Configuring the Daily Tariff Schedule in Chapter 5).
Chapter 3 Using Front Display Data Displays Register 1 - total readings: kWh delivered kW delivered maximum demand kW delivered cumulative maximum demand Register 2 - total readings: kWh received kW received maximum demand kW received cumulative maximum demand Register 3 - total readings: kvarh delivered kvar delivered maximum demand kvar delivered cumulative maximum demand Register 4 - total readings: kvarh received kvar received maximum demand kvar received cumulative maximum demand Register 1 – tari
Chapter 3 Using Front Display Data Displays Register 1 – tariff 2 readings: kWh delivered kW delivered maximum demand kW delivered cumulative maximum demand Register 2 – tariff 1 readings: kWh received kW received maximum demand kW received cumulative maximum demand … … Register 4 – tariff 2 readings: kvarh received kvar received maximum demand kvar received cumulative maximum demand Previous Billing Period Data The following example demonstrates billing displays for the three previous billing periods.
Chapter 3 Using Front Display Data Displays Register 1 - total readings: kWh delivered kW delivered maximum demand kW delivered cumulative maximum demand Register 2 - total readings: kWh received kW received maximum demand kW received cumulative maximum demand … … Register 1 – tariff 1 readings: kWh delivered kW delivered maximum demand kW delivered cumulative maximum demand … … Engineering Maximum Demand Data Display Maximum demand displays show engineering maximum demands (not billing maximum deman
Chapter 3 Using Front Display Data Displays Delivered kW maximum demand Delivered (inductive) kvar maximum demand Delivered kVA maximum demand Received kW maximum demand Received (capacitive) kvar maximum demand Va-Vc maximum demand Indicate Vab-Vca voltage in line-to-line configurations. Ia-Ic maximum demand Va-Vc THD maximum demand. Indicate Vab-Vca THD in line-to-line configurations.
Chapter 3 Using Front Display Data Displays Ia-Ic THD maximum demand Engineering Data Display Engineering data represent general instrumentation data you can use while installation and inspecting the meter. Use phase angles displays to check the order of phases when connecting wires to the meter terminals. Phase-to-neutral voltages. Only displayed in 4-wire configurations with a neutral.
Chapter 3 Using Front Display Data Displays Total powers and power factor Voltage unbalance, % Current unbalance, % Line frequency Phase voltage THD Indicate phase-to-phase voltage THD in line-to-line configurations Phase current THD and TDD Short-term and long-term voltage flicker EM920 Power Quality and Revenue Meter 43
Chapter 3 Using Front Display Data Displays Waveform Display The waveform display shows per-phase voltage and current waveforms. Use the SCROLL button to scroll through the phases. Per-phase voltage and current waveforms Harmonics Display Harmonics display shows per-phase voltage and current harmonic spectrum graphs. Use the SCROLL button to scroll through the voltage and current channels.
Chapter 3 Using Front Display Data Displays Phasor Display The phasor display shows a three-phase network phasor diagram. All phase angles are given relatively to the Va channel. Three-phase voltage and current phasor diagram Setup Data Display The setup data display shows basic device settings that can be required for immediate inspecting while meter testing and at the time of installation.
Chapter 3 Using Front Display Data Displays Meter identification info: serial number, production date and calibration date Meter operation time counters (since start of operation): Start of operation date Total operation time in hours Out of service time in hours Total number of power failures Total number of 3-phase voltage interruptions Internal meter temperature Lithium battery status, replacement date and operation time in hours Meter firmware information: Host processor firmware version Fast transie
Chapter 3 Using Front Display Data Displays Device Diagnostics Display The diagnostics display shows device diagnostic messages recorded as a result of the meter self-test diagnostics during start-up and operation. If there are more pages, use a short press on the SCROLL button to scroll through the entire list of messages. Extended press SCROLL + SELECT/ENTER is a shortcut for immediate entering the passwordprotected diagnostics reset menu.
Chapter 3 Using Front Display Programming Mode Programming Mode To enter programming mode from the data display, press and hold the SELECT/ENTER button for more than 5 seconds. Navigation Buttons The following table gives a summary of the button operations in programming mode.
Chapter 3 Using Front Display Programming Mode Password Security The setup menus are secured by 8-digit user passwords. Every time you enter programming mode, you are prompted for a correct password. The meter is primarily shipped with all passwords preset to 9 at the factory. See Meter Security in Chapter 2 for more information on the meter security levels.
Chapter 3 Using Front Display Programming Mode NOTE Access to the Reset menu entries is allowed depending on your security level as shown in Section Reset of Accumulators and Log Files in Chapter 6. If your security level does not allow access to a menu, it will not be listed in the main menu list, and you will not be able to highlight menu items that you are not allowed to change, but you can still view their present settings.
Chapter 3 Using Front Display Programming Mode To exit the submenu and return to the main menu: 1. If the upper-right window is not highlighted yet, highlight it by briefly pressing the SELECT/ENTER button. 2. Press the SELECT/ENTER button for more than 1 second. You will return to the main menu. To exit the main menu and return to the data display: 1. Press briefly the SELECT/ENTER button to highlight the right-upper Exit window. SCROLL 2. Press the SELECT/ENTER button for more than 1 second.
Chapter 4 Using PAS Software Software Installation Chapter 4 Using PAS Software The support PAS software is a configuration and data acquisition tool that allows you to configure all of the EM920 features, monitor your meter on-line, retrieve recorded files and view reports. PAS can communicate with your meter via any communication interface installed in your meter, including the embedded infrared port, serial ports, and the Ethernet and wireless GSM/GPRS communications.
Chapter 4 Using PAS Software Software Installation Connect the EM920 to your PC’s USB port using the supplied USB cable. When the EM920 is powered up, Windows automatically detects the meter and launches the hardware installation wizard. The following example demonstrates an installation of the USB driver on Windows XP. 1. The "Found New Hardware Wizard" dialog box is displayed as follows. 2. Select “Install from a list or specific location” and click “Next”. 3. Click “Browse”.
Chapter 4 Using PAS Software Software Installation 4. Point to the “USB” folder located in the PAS installation directory and click “OK” 5. Click “Next”. 6. Click "Finish" to complete installation.
Chapter 4 Using PAS Software Creating a New Site for your Meter The next time you power up the EM920 or connect it to your PC with the USB cable, Windows automatically launches the driver for your meter. Creating a New Site for your Meter PAS keeps all communication and configuration data for your meter in a configuration database called a site database.
Chapter 4 Using PAS Software Setting up Communications “Sites” directory. Type a site name for your device in the “File name” box, click New, and then click OK. 4. On the Instrument Setup tab, select “EM920” in the “Model” box. PAS automatically selects the appropriate instrument options for your meter. 5. Select a correct CT secondary current (5A or 1A) for your meter. 6. If you wish to add any comments for your meter, type them into the “Comment” box.
Chapter 4 Using PAS Software Setting up Communications Selecting the Communications Protocol 1. On the Connection tab, click Protocol. 2. In the “Protocol” box, select the same communications protocol as you have set in your device. 3. The remaining settings in this dialog do not normally need to be changed. 4. In the “Response Time-out” box, define the maximum time that PAS should wait for the meter response before announcing a failure.
Chapter 4 Using PAS Software Setting up Communications 4. In the “Protocol” box, select the communications protocol for the TCP port. The meter provides Modbus/TCP connections on TCP port 502 and DNP3/TCP connections on port 20000. The host port is set automatically as you select the protocol. Select “Modbus RTU/TCP” for Modbus/TCP or “DNP3” for DNP3/TCP. 5.
Chapter 4 Using PAS Software Setting up Communications 3. Click on the “IP address” and type in the IP address your meter got from the GPRS provider when registering on the GPRS network. You can find the meter GPRS IP address on the GPRS page in the Device Info display (see Device Info Display in Chapter 3) or via the Dial-Up Networking setup dialog in PAS (see Modem/GPRS IP Address in Setting-Up Dial-Up GPRS Network in Chapter 5) 4.
Chapter 4 Using PAS Software Setting up Communications 2. Click Dial. Communicating through a USB On the Instrument Setup tab, click USB Port, and then click OK.
Chapter 4 Using PAS Software Setting Up the Meter Setting Up the Meter PAS allows you to prepare setup data for your meter off-line without the need to have it connected to your PC. To prepare a setup for your meter: 1. Select the device site from the list box on the PAS toolbar. 2. Select the desired setup group from the Meter Setup menu. Click on the tab with the setup you want to create or modify. 3. Fill in the boxes with the desired configuration data for your meter. 4.
Chapter 4 Using PAS Software Setting Up the Meter Downloading Setups to the Meter You can update each setup in your meter one at a time or download all setups together from the site database. Individual Download To update a particular setup in your meter: 1. Check the On-line button on the PAS toolbar 2. Select a meter site from the list box on the toolbar. 3. Select the desired setup group from the Meter Setup menu. Click on the setup tab you want to download to the meter.
Chapter 4 Using PAS Software Authorization and Security 2. Select the device site from the list box on the toolbar. 3. Select Upload Setups from the Meter Setup menu. NOTE The passwords setup is never uploaded via the Batch Upload and may not be read from the meter. When you open the Passwords setup dialog, all passwords are zeroed. Authorization and Security Every time you try to send the setup data to the meter, you are prompted for the password. Enter the password and click OK.
Chapter 5 Configuring the EM920 Configuring Communications Chapter 5 Configuring the EM920 This chapter describes how to configure the EM920 for your particular environment and application from the front display and via PAS. To access your meter configuration options via PAS, you should create a site database for your device as shown in Chapter 4. Configuring Communications Setting Up Serial Communication Ports Using the Front Display Select COM1 through COM4 from the main menu.
Chapter 5 Configuring the EM920 Display Label Parameter Configuring Communications Options Default Description Protocol Communication protocol Modbus RTU, Modbus ASCII, DNP3, IEC 62056-21 IEC 62056-21 (COM1) Modbus RTU (COM3-4) The communications protocol for the port Interface Port interface RS232, RS485, IR, GPRS IR (COM1) GPRS (COM2) RS485 (COM34) Not changeable; automatically detected by the meter Address Device address Modbus: 1-247 DNP3: 0-65532 IEC 62056-21: 0-65532 1 Device networ
Chapter 5 Configuring the EM920 Configuring Communications Setting Up the Ethernet Using the Front Display Select Network Setup from the main menu. See Viewing and Changing Setup Options in Chapter 3 for information on navigating in menus. See the table below for available network options. Using PAS Select Communications Setup from the Meter Setup menu, and then click on the Network Setup tab. The following table lists available network options.
Chapter 5 Configuring the EM920 Configuring Communications Setting-Up Dial-Up GPRS Network Select Communications Setup from the Meter Setup menu, and then click on the Dial-Up Networking Setup tab. The following table lists available connection options. Parameter Options Default Description Connection Options IP Address 192.168.10.203 The IP address on the dial-in modem PPP network. Not used in a GPRS network. Network Subnet Mask 255.255.0.
Chapter 5 Configuring the EM920 Parameter Configuring Communications Options Default Description ISP Account Phone Number *99# The telephone number of the ISP provider. The default number provides a connection to the GPRS network for your EM920 GSM/GPRS modem. Login Name Login name for logging onto the Internet (if required) Login Password Login password for logging onto the Internet (if required).
Chapter 5 Configuring the EM920 Configuring Communications Parameter Options Default Description SNTP Client Enabled NO, YES NO Enables operations of the SNTP client Polling interval, s 60-86400 s 600 s The time remaining requesting time from the SNTP server Primary SNTP Server IP Address 192.36.143.151 The IP address of the primary SNTP server Secondary SNTP Server IP Address 130.149.17.
Chapter 5 Configuring the EM920 Configuring Communications Parameter Options XPW Client Enabled NO, YES Time to Next Session, min 1-99999 Connection via Network Ethernet, GPRS/Modem Default NO Description Enables operations of the eXpertPower client The time remaining to the next connection session Ethernet Automatically selected depending on the network module installed NOTES 1. Do not enable the eXpertPower client in your meter if you do not use the eXpertPowerTM service. 2.
Chapter 5 Configuring the EM920 Parameter Client Enabled Configuring Communications Options NO, YES Server IP Address Default Description NO Enables operations of the notification client 192.168.0.
Chapter 5 Configuring the EM920 General Meter Setup General Meter Setup Basic Meter Setup The Basic Setup provides the meter with basic information about your electrical network. Using the Front Display Select Basic from the main menu. See Viewing and Changing Setup Options in Chapter 3 for information on navigating in menus. See the table below for available options. Using Pas Select General Setup from the Meter Setup menu. The following table lists available meter configuration options.
Chapter 5 Configuring the EM920 Display Label General Meter Setup Parameter Nom. Voltage PT Secondary (L-L) Voltage CT Primary CT Primary Current CT4 Primary Options Default Description 50-480 V 120 V The nominal secondary line-toline voltage. Used as a reference voltage for the EN50160 evaluation. 1-20,000 A 5A The primary rating of the phase current transformer I4 CT Primary Current 1-20,000 A 5A The primary rating of the I4 current transformer Nom.
Chapter 5 Configuring the EM920 General Meter Setup Device Options and Mode Control Using the Front Display To enter the device options setup menu, select Options from the main menu. To enter the TEST mode menu, select Test Mode Setup from the main menu. You can also directly enter the TEST menu by extended press on the TEST button located under the meter cover (see The TEST Button in Chapter 3). See Viewing and Changing Setup Options in Chapter 3 for information on navigating in menus.
Chapter 5 Configuring the EM920 General Meter Setup NOTE Test Mode options and other device options have different security levels. You may not be allowed to change the device options if the user password you provided does not have required permissions. The following table lists available device options.
Chapter 5 Configuring the EM920 General Meter Setup Power Calculation Modes The power calculation mode option allows you to change the method for calculating reactive and apparent powers in presence of high harmonics. The options work as follows: 1. When the reactive power calculation mode is selected, active and reactive powers are directly measured and apparent power is calculated as: S = P 2 + Q2 2.
Chapter 5 Configuring the EM920 General Meter Setup Tariff rate number Tariff code Tariff input 1 Tariff input 2 Tariff input 3 1 Open Open Open 2 Closed Open Open 3 Open Closed Open 4 Closed Closed Open 5 Open Open Closed 6 Closed Open Closed 7 Open Closed Closed 8 Closed Closed Closed Instrument Transformer Correction Setup Transformer correction allows you to compensate ratio and phase angle inaccuracies of the voltage and current instrument transformers.
Chapter 5 Configuring the EM920 Parameter Phase Angle Error General Meter Setup Options +/-600 minutes Description The phase displacement, in minutes, between the primary and secondary values. The phase angle of a transformer is positive when the secondary value leads the primary value. You can define a total of 56 correction points for ratio and phase correction data - up to 8 test points per voltage and current channel, based on the transformer’s accuracy characteristics.
Chapter 5 Configuring the EM920 General Meter Setup The available options are described in the following table. Parameter Options Description Metering and Location Loss Compensation Enabled Disabled, Enabled Enables/disables loss compensation Metering Point Location Supply side, far end, Supply side, transformer end, Load side, transformer end, Load side, far end Defines the location of the meter: far end – near the supply source or near the load, transformer end – near the power transformer.
Chapter 5 Configuring the EM920 General Meter Setup metering and billing points. Use the picture and table below to check your settings.
Chapter 5 Configuring the EM920 General Meter Setup Local Settings This setup allows you to specify your local time zone, daylight savings options and a time synchronization source. Using the Front Display Select Local from the main menu. See Viewing and Changing Setup Options in Chapter 3 for information on navigating in menus. See the table below for available options. Using PAS Select General Setup from the Meter Setup menu, and then click on the Local Settings tab.
Chapter 5 Configuring the EM920 Display Label General Meter Setup Parameter Options Default Description Daylight Daylight saving time (DST) Disabled Enabled Scheduled Disabled Disabled: the RTC operates in standard time only. Enabled: the time is automatically updated at the predefined fixed DST switch dates. Scheduled: the time is automatically updated at the calendar scheduled DST switch dates. Start Month DST Start Month JanuaryDecember March The month when DST begins.
Chapter 5 Configuring the EM920 General Meter Setup Using the IRIG-B Select the GPS IRIG-B option and connect the GPS master clock to the meter IRIG-B input. See the EM920 Installation Manual for the connection diagram. The EM920 automatically synchronizes its clock with the GPS time each second, normally with accuracy better than one millisecond if the time is locked to the GPS satellite time.
Chapter 5 Configuring the EM920 General Meter Setup Display Setup Using the Front Display Select Display from the main menu. See Viewing and Changing Setup Options in Chapter 3 for information on navigating in menus. See the table below for available display options. Using PAS Select General Setup from the Meter Setup menu, and then click on the Display Setup tab. The available options are listed in the table below.
Chapter 5 Configuring the EM920 Display Label General Meter Setup Parameter Options Default Description Auto-Scroll Auto-Scroll Interval Disabled, 2-10, 15, 20, 25, 30 seconds 5 Defines the display scroll interval or disables autoscroll Scroll Sequence Auto-Scroll Sequence 1 1-2 1-3 1-4 1-5 1-6 1-6, 10 1-6, 10-11 1-6, 10-12 1, 5, 10-12 1-2, 5, 10-12 1-3, 5, 10-12 1, 6, 10-12 1-2, 6, 10-12 1-3, 6, 10-12 1-4, 6, 10-12 1, 10-12 1-2, 10-12 1-3, 10-12 1-4, 10-12 1, 11-12 1-2, 11-12 1-3, 11-12 1-4, 1
Chapter 5 Configuring the EM920 General Meter Setup Configuring Digital Inputs The EM920 has two embedded digital inputs (DI1-DI2) and can provide one additional expansion module with a total of 8 digital inputs (DI3 through DI10). I/O numbers are automatically assigned to the inputs. To configure the digital inputs, select General Setup from the Meter Setup menu, and then click on the Digital Inputs tab. Digital inputs that are not present in your meter are not shown.
Chapter 5 Configuring the EM920 Parameter Fault Recorder Options Checked Unchecked General Meter Setup Default Unchecked Description When the box is checked, a positive transition on the digital input (open to closed transition event) triggers the Fault recorder. Debounce Time The debounce time is assigned in groups of 2 adjacent digital inputs. DI1 and DI2 have the same debounce time, while DI3 and DI4 are allowed to have another setting.
Chapter 5 Configuring the EM920 General Meter Setup Configuring Relay Outputs The EM920 has one embedded relay output (RO1) and can provide one additional expansion module with a total of 6 relay outputs (RO2 through RO7). I/O numbers are automatically assigned to outputs. To configure the relay outputs in your meter, select General Setup from the Meter Setup menu, and then click on the Relay Outputs tab. Relays that are not present in your meter are not shown.
Chapter 5 Configuring the EM920 Parameter General Meter Setup Options Default Description Polarity NORMAL (N.O.) INVERTING (N.C.) NORMAL Normal polarity: the relay is normally deenergized in its non-active state and is energized in its active (operated) state. Inverting polarity: the relay is normally energized in its non-active state and is deenergized in its active (operated) state. It is called failsafe relay operation. Retentive mode NO YES NO Applicable for latched relays only.
Chapter 5 Configuring the EM920 General Meter Setup Configuring Analog Outputs The EM920 can provide one AO expansion module with a total of 4 analog outputs with options for 0-1 mA, ±1mA, 0-20 mA and 4-20 mA. To configure the analog outputs, select General Setup from the Meter Setup menu, and then click on the Analog Outputs tab. The setup entries will be blanked if the AO expansion module is not installed in the meter. The available analog output options are described in the following table.
Chapter 5 Configuring the EM920 General Meter Setup When you select an output parameter for the analog output channel, the default engineering scales are set automatically. They correspond to the maximum available scales. If the parameter actually covers a lower range, you can change the scales to provide a better resolution on an analog output.
Chapter 5 Configuring the EM920 General Meter Setup the 0 mA scale to the negative full scale and the 1 mA scale to zero for bi-directional parameters. • ±2 mA: set the 1 mA scale to ½ of the required fullscale output for both uni-directional and bi-directional parameters. For example, to provide the 0 to 2 mA output current range for Volts measured by the meter in the range of 0 to 120V, set the 1 mA scale to 60V; then the 120V reading will be scaled to 2 mA.
Chapter 5 Configuring the EM920 General Meter Setup Using Counters The EM920 provides 8 universal nine-digit counters that you can use for counting different events. Each counter can be independently linked to any digital input and count input pulses with a programmable scale factor. You can link a number of digital inputs to the same counter. Each counter can also be incremented through the Control Setpoints in response to any internal or external event.
Chapter 5 Configuring the EM920 General Meter Setup Using Periodic Timers The EM920 has 4 programmable interval timers that are normally used for periodic recording and triggering operations on a time basis through the Control Setpoints. Whenever a programmed timer interval is expired, the timer generates an internal event that can trigger any setpoint (see Using Control Setpoints). The programmable time interval can be from 1 cycle and up to 24 hours. Though it is defined in 0.
Chapter 5 Configuring the EM920 General Meter Setup Using Control Setpoints The EM920 has an embedded logical controller that runs different actions in response to user-defined internal and external events. Unlike a PLC, the EM920 uses a simplified programming technique based on setpoints that allows the user to define a logical expression based on measured analog and digital values that produces a required action. The EM920 provides 16 control setpoints with programmable operate and release delays.
Chapter 5 Configuring the EM920 Option Relation General Meter Setup Format/Range <=, >=, =, ON, OFF Description The relational operator used in the conditional expression for the trigger Operate limit The threshold (in primary units) at which the conditional expression would be evaluated to true. Not applicable for digital triggers. Release limit The threshold (in primary units) at which the conditional expression would be evaluated to false. Defines the hysteresis for analog triggers.
Chapter 5 Configuring the EM920 General Meter Setup Using Numeric Triggers For numeric (analog) triggers, a setpoint allows you to specify two thresholds for each trigger to provide hysteresis (dead band) for setpoint operations. The Operate Limit defines the operating threshold, and the second Release Limit defines the release threshold for the trigger. The trigger thresholds are always specified in primary units.
Chapter 5 Configuring the EM920 General Meter Setup setpoint triggers. When the setpoint event is asserted, the timer is restarted, and then generates the next timer event when the timer interval expires. If you wish to record interval data at predefined intervals without linking to other events, just select a timer as a setpoint trigger and specify in the setpoint actions list a data log file you want to use for recording.
Chapter 5 Configuring the EM920 General Meter Setup logging and waveform logging that are shared between all setpoints using an OR scheme for each separate target. A relay output is operated when one of the setpoints linked to the relay is activated and stays in the operated state until all of these setpoints are released (except for latched relays that require a separate release command to be deactivated).
Chapter 5 Configuring the EM920 Configuring Billing/TOU Configuring Billing/TOU The EM920 provides 10 universal billing energy registers that can be linked to any internal energy source or to any external pulse source that delivers pulses through the device digital inputs. Any of energy registers can provide either a single-tariff energy accumulation or be individually linked to the TOU system providing both total and multi-tariff energy billing.
Chapter 5 Configuring the EM920 Configuring Billing/TOU Configuring Billing/Tariff Registers To configure the meter billing/TOU Energy/TOU from the Meter Setup menu.
Chapter 5 Configuring the EM920 Parameter Options Configuring Billing/TOU Default Description Channel None, Ch1-Ch6 None Defines a measurement channel for multimeter energy metering. Not used for a single self-metering channel if there are no external sources. Set to Ch1 for internal energy sources, and to Ch2 through Ch6 for external sources in the event of multichannel energy metering.
Chapter 5 Configuring the EM920 Configuring Billing/TOU The daily profile setup allows you to specify the daily tariff change points with a 15-minute resolution for 4 seasons using 4 different daily schedules for each season. To configure your daily profiles: 1. Select the desired season and day type. 2. Select the start time for each tariff change point and the corresponding active tariff number. 3. Repeat the setup for all active profiles.
Chapter 5 Configuring the EM920 Configuring Billing/TOU for working days and holidays through all seasons in any order that is convenient for you, based on simple intuitive rules. There are no limitations on how to define your schedule. The meter is able to automatically recognize your settings and to select a proper daily tariff schedule for any day within a year. The above picture gives you an example of a single-season tariff schedule configured for weekends and the designated U.S.A. holidays.
Chapter 5 Configuring the EM920 Configuring Recorders Configuring Recorders The EM920 is provided with a 16-MByte onboard flash memory for data, event and waveform recording. The meter memory is fully configurable except of the files that keep monthly and daily billing profiles and energy load profile. They are pre-configured at the factory and may not be changed by the user.
Chapter 5 Configuring the EM920 Option Configuring Recorders Range Description Sections/Channels 0-20 The numbers of sections in a multi-section profile data log file, or the number of recording channels in a waveform log file Num. of Records 0-65535 Allocates the file memory for predefined number of records Record size Parameters The size of the file record for a single channel or a single section.
Chapter 5 Configuring the EM920 Configuring Recorders The following table can help you calculate an estimated file size for conventional log files when planning your memory allocation. The actual file size will normally be a bit bigger.
Chapter 5 Configuring the EM920 Configuring Recorders Configuring the Event Recorder To configure the Event log file: 1. Double click on the Event Log file partition with the left mouse button. 2. Select a desired file type for your file. 3. Select the maximum number of records you want to be recorded in the file. 4. Click OK, then send your new setup to the meter or save to the device database.
Chapter 5 Configuring the EM920 Configuring Recorders 2. Select a partition type for your file. 3. Select the number of parameters you want to be recorded in the file records. 4. Select the maximum number of records you want to be recorded in the file. 5. Click OK, and then send your new setup to the meter, or save to the device database. To define the contents of the file: 1.
Chapter 5 Configuring the EM920 Configuring Recorders 3. For your convenience, PAS follows your selection and helps you configure a series of the neighboring parameters: when you open the “Group” box for the next parameter, PAS highlights the same group as in your previous selection; if you select this group again, PAS automatically updates the “Parameter” box with the following parameter in the group. 4. Add the name for your data log file in the “Name” box. It will appear in the data log reports. 5.
Chapter 5 Configuring the EM920 Configuring Recorders Data Log #2 No.
Chapter 5 Configuring the EM920 Configuring Recorders Data Log #14 No. Parameter 1 Generic voltage V1/V12 2 Generic voltage V2/V23 3 Generic voltage V3/V31 4 Generic current I1 5 Generic current I2 6 Generic current I3 7 Generic current I4 8 Generic frequency EN50160 Statistics Data Logs Data log #9 and Data log #10 are pre-configured for recording EN50160 compliance statistics and harmonics survey data. See EN50160 Statistics Log Files in Appendix E for the file layout and contents.
Chapter 5 Configuring the EM920 Configuring Recorders Configuring the Waveform Recorder The EM920 can store waveforms in three log files. Configurable waveform log files #1 and #2 can record waveforms at four programmable sampling rates: 32, 64, 128 or 256 samples per cycle. A log file stores up to 7 channels simultaneously (three voltage channels and four current channels) with a programmable length and up to 20 pre-event cycles. Waveform log file #3 is pre-configured for fast transient recording.
Chapter 5 Configuring the EM920 Configuring Recorders 2. Select a file type for your file. 3. Select the number of channels for simultaneous recording in the file to define the file record size. 4. Select the maximum number of records you want to be recorded in the file.
Chapter 5 Configuring the EM920 Configuring Recorders The following table lists available waveform options. Parameter Recording Time Options Fixed Event-controlled Description Fixed – a waveform is recorded up to the maximum specified length Event-controlled – a waveform extends for as long as trigger conditions exist plus post-event time, or up to the maximum specified length Samples per Cycle 32, 64, 128, 256, 1024 Waveform sampling rate Max.
Chapter 5 Configuring the EM920 Configuring Recorders 5. Save your waveform setup to the device database, and then send it to the meter.
Chapter 5 Configuring the EM920 Configuring Recorders Configuring the Fault Recorder The Fault recorder automatically records all fault events to the Fault log file. It can be triggered via the embedded fault detector, or externally through any of the 8 digital inputs. The Fault recorder can be globally disabled or enabled in your meter.
Chapter 5 Configuring the EM920 Option Configuring Recorders Range Default Description Hysteresis, % 0-50.0% 5.0 Defines the hysteresis for a fault trigger in percent of the threshold Trigger Enabled Checked Unchecked Checked Links a fault trigger to the Fault Recorder. If the box is unchecked, the Fault Recorder does not respond to the trigger. On Start Checked Unchecked Checked On End Checked Unchecked Unchecked Enables waveform log when the fault event ends Log No.
Chapter 5 Configuring the EM920 Configuring Recorders adjust the thresholds according to your network conditions before enabling triggers. The Current Unbalance trigger has a different calculation algorithm than the common current unbalance measurements. Since the unbalance readings give a relation of the maximum deviation from the average to the phase average current, the value could produce high readings for low currents.
Chapter 5 Configuring the EM920 Configuring the EN50160 Recorders Configuring the EN50160 Recorders See EN50160 Evaluation and Recording in Appendix F for information on EN50160 evaluation techniques. Basic Device Settings The following device settings affect the EN50160 evaluation and should be checked prior to running the EN50160 recorders.
Chapter 5 Configuring the EM920 Configuring the EN50160 Recorders can be selected independently from the EN50160 compliance evaluation. You can upload and view the harmonics survey data collected by your device via PAS reports or via common PAS data logs views. EN50160 Power Quality Event Log The EM920 provides the EN50160 Power Quality (PQ) recorder that can detect EN50160 incidents and record each individual power quality event to the log file with the start and end timestamps and a fault magnitude.
Chapter 5 Configuring the EM920 Configuring the EN50160 Recorders To configure the PQ recorder: 1. Select Memory/Log from the Meter Setup menu, and then click on the EN50160 PQ Recorder tab. 2. Adjust thresholds and hysteresis for PQ triggers if required. The harmonic and interharmonic voltage limits can be individually set for each harmonic order via the EN50160 Harmonics Setup. Limits for the signaling voltage frequencies are automatically taken from the “Meister-curve”. 3.
Chapter 5 Configuring the EM920 Option Configuring the EN50160 Recorders Range Default Description PQ Log Threshold, % 0-200.0% Defines the operating threshold for a PQ trigger in percent of the nominal (reference) value Hysteresis, % 0-50.0% Enabled Checked Unchecked On Start Checked Unchecked Checked Enables waveform log when a PQ event starts On End Checked Unchecked Unchecked Enables waveform log when a PQ event ends Log No. 1-2 5.
Chapter 5 Configuring the EM920 Configuring the EN50160 Recorders longer waveform will be also recorded, synchronized with the fast transient waveform. You can temporary disable the PQ recorder in your meter. To enable or disable the PQ recorder: 1. Check or uncheck the Recorder Enabled checkbox. 2. Send your setting to the device. Note that disabling the PQ recorder in your meter does not affect the evaluation and recording of the EN50160 statistics.
Chapter 5 Configuring the EM920 Configuring the EN50160 Recorders The default EN50160 compliance limits are shown in the picture above. You can change the number of the evaluated harmonics and interharmonics via the EN50160 Advanced Setup. EN50160 Advanced Setup The EN50160 Advanced Setup allows you to configure the EN50160 evaluation options in your meter. To configure the EN50160 evaluation options: 1. Select Memory/Log from the Meter Setup menu, and then click on the EN50160 Advanced Setup tab. 2.
Chapter 5 Configuring the EM920 Option Configuring the EN50160 Recorders Range Default Description Rapid Voltage Changes Repetition Rate 1-10 1 Defines the maximum repetition rate in variations per hour (equal or less than) for rapid voltage changes. Voltage changes at higher rates are not classified since they will be subject for flicker. Pst Period 1-10 min 10 min THD, up to order 25-50 40 Defines the highest harmonic order included in the THD evaluation.
Chapter 5 Configuring the EM920 Configuring Communication Protocols Configuring Communication Protocols This section describes how to customize protocol options for use with your application software. Configuring Modbus Modbus Point Mapping The EM920 provides 120 user assignable registers in the address range of 0 to 119.
Chapter 5 Configuring the EM920 Configuring Communication Protocols EM920 Modbus Reference Guide for a list of the available registers. Note that 32-bit Modbus registers should always start at an even register address. 4. Click Send to download your setup to the device. Configuring DNP3 DNP Options can be changed both via DNP3 and Modbus. Refer to the EM920 DNP3 Reference guide for information on the protocol implementation and a list of the available data points.
Chapter 5 Configuring the EM920 Parameter Configuring Communication Protocols Options Binary Input Change Event Object Without Time With Time Number of AI to Generate events 0-64 Analog Input Object Analog Input Change Event Object Default With Time Description The default BI change event object variation for requests with qualifier code 06 when no specific variation is requested Analog Inputs (AI) 43 The total number of AI change event points for monitoring 32-bit 32-bit –Flag 16-bit 16-bit –Fl
Chapter 5 Configuring the EM920 Configuring Communication Protocols 3 The total number of AI, BI and BC change event points may not exceed 64. When you change the number of the change event points in the device, all event setpoints are set to defaults (see Configuring DNP Event Classes below).
Chapter 5 Configuring the EM920 Configuring Communication Protocols Configuring DNP Event Classes The EM920 generates object change events for any static analog input, binary input, and binary counter point when a corresponding point either exceeds a predefined threshold, or the point status changes. A total of 64 change event points are available for monitoring. Object change events are normally polled via DNP Class 1, Class 2 or Class 3 requests.
Chapter 5 Configuring the EM920 Configuring Communication Protocols The number of event setpoints for each static object type is specified via the DNP Options setup. NOTE The device clears all event buffers and links the default set of static points to each event object type every time you change the number of points for any of the objects. To define setpoints for selected static points: 1. Check the “Ext” box if you wish to use the extended point list. 2.
Chapter 5 Configuring the EM920 Configuring Communication Protocols • Less than (under) - a new event is generated when the point value drops below the specified threshold, and then when it returns above the threshold plus a predefined return hysteresis – applicable for AI objects. Hysteresis for the return threshold is 0.05 Hz for frequency and 2% of the operating threshold for all other points. 4. Check the “Ev On” box for the points you wish to be included into event poll reports. 5.
Chapter 5 Configuring the EM920 Configuring Meter Passwords Configuring Meter Passwords Using the Front Display Select Access from the main menu. You should have administration rights to enter this menu. See Viewing and Changing Setup Options in Chapter 3 for information on navigating in menus. The setup menu allows you to configure three passwords for three security levels the meter provides. To setup the meter passwords: 1. Use the SCROLL button to scroll through the passwords. 2.
Chapter 5 Configuring the EM920 Configuring Meter Passwords The present passwords settings are never uploaded from the meter via the Passwords setup. When you open the dialog, all passwords are zeroed. To setup new passwords: 1. Enter the first (lower-level) password in the “Password 1” box and repeat it in the following “Confirm password” box. 2. In the same manner, enter Password 2 and Password 3 for the medium and high-level security passwords. 3.
Chapter 6 Device Control and Upgrading Updating the Meter Clock Chapter 6 Device Control and Upgrading This chapter describes how to perform control functions in your meter from the front panel display and via PAS. To access device control options from PAS, you should have your meter online and provide a correct password with respective permissions. Updating the Meter Clock Using the Front Display To enter the clock setup menu, select RTC Setup from the main menu.
Chapter 6 Device Control and Upgrading Clearing Device Diagnostics Clearing Device Diagnostics Using the Front Display See the following section Reset of Accumulators and Log Files on how to clear the device diagnostics from the front display. Using PAS Via PAS, you can both examine diagnostics status, and clear it. the present device To enter the Device Diagnostics dialog, select Device Control from the Monitor menu, and then click on the Device Diagnostics tab.
Chapter 6 Device Control and Upgrading Reset Entry Reset of Accumulators and Log Files Menu Function Security Level Diagnostic Reset of device diagnostics Low Power MD Volt/Amp MD Volt MD Ampere MD Harmonic MD All MD Reset of engineering maximum demands Low Device Oper. Time Reset of the meter operation time counters Medium Battery Oper. Time Reset of the lithium battery operation time counters Medium Power Failures Reset of the meter failure counters Medium To reset a desired entry: 1.
Chapter 6 Device Control and Upgrading Reset of Accumulators and Log Files To reset the accumulation counters or to clear a file: 1. Click on the corresponding button. If a reset entry has more than one target, you are allowed to select targets from the dialog box. 2. Check the corresponding boxes, and then click OK. 3. Confirm your command to send it to the meter. NOTE The “Clear All Log Files” entry does not affect billing data and energy load profile files.
Chapter 6 Device Control and Upgrading Reset of Billing Maximum Demands Reset of Billing Maximum Demands A demand reset signals an end of the present billing period and causes the following automatic actions: • increments the number of the recorded billing periods.
Chapter 6 Device Control and Upgrading Master Reset (Clearing Billing Data) Master Reset (Clearing Billing Data) The EM920 permits the clearing billing data via the Master Reset menu. This menu also allows you to reset the meter configuration setups to their factory defaults. The Master Reset menu is secured by the jumper located on the backside of the display board under the TEST button. To enter the Master Reset menu, remove the security jumper and then select Master Reset from the main menu.
Chapter 6 Device Control and Upgrading Operating Event Flags Operating Event Flags The EM920 has 8 common event flags that are intended for use as temporary event storage and can be tested and operated from the control setpoints. You can transfer an event to the setpoint and trigger its operation remotely by changing the event status through PAS. To enter the Event Flags dialog, select Device Control from the Monitor menu, and then click on the Event Flags tab.
Chapter 6 Device Control and Upgrading Upgrading Meter Firmware To change the status of an event flag: 1. In the “Status” box, select the desired flag status. 2. Click on Send. Upgrading Meter Firmware You can upgrade device firmware through any communication port installed in your meter: a serial port, USB, wireless GSM/GPRS modem, or via the Internet. Downloading firmware is only supported through the Modbus RTU/ASCII and Modbus/TCP protocols.
Chapter 6 Device Control and Upgrading Upgrading Meter Firmware 5. Wait about 10 seconds until the meter completes burning firmware into the flash and reboots before any further manipulating with the meter. NOTES 1. When the meter reboots, the Ethernet and GPRS networks are both restart, so communications may be temporarily lost. You may need to wait a short duration before PAS restores a connection with your meter. 2.
Chapter 7 Monitoring Meters Viewing Real-time Data Chapter 7 Monitoring Meters Viewing Real-time Data Real-time data is continuously retrieved from your devices and updated on the screen at the rate you defined in the Instrument Setup. To get real-time data from your device: 1. Ensure that the On-line button on the PAS toolbar is checked. 2. Select the device site from the list box on the PAS toolbar. 3. Point to RT Data Monitor on the Monitor menu, and then select a data set you want to view.
Viewing Real-time Data Chapter 7 Monitoring Meters Polling Devices To run data polling, click on either the Poll button Continuous Poll button Stop button or on the local toolbar. Click on the to stop continuous polling. You can open as many monitor windows as you wish, either for different sites, or for the same site using different data sets. An open data monitor window is linked to the current site and does not change if you select another site in the site list.
Chapter 7 Monitoring Meters Viewing Real-time Data Viewing a Data Table Changing the Data View PAS displays data in either a single record or multi-record view. To change the view, click on the Data Monitor window with the right mouse button and select either Wrap to see a single record, or UnWrap to go to the multi-record view.
Viewing Real-time Min/Max Log Chapter 7 Monitoring Meters Printing Data To check the report, as it will look when printed, select Print Preview from the File menu. button on the PAS To print retrieved data, click on the toolbar, select a printer, and then click OK. Real-time Data Logging PAS allows you to store data records to a database automatically at the time it updates data on the screen. To setup the real-time logging options: 1. Open the Data Monitor window. 2.
Chapter 7 Monitoring Meters Viewing Real-time Harmonic Spectrum Viewing Real-time Harmonic Spectrum To retrieve real-time harmonic spectrum from your meter: 1. Check the On-line button on the PAS toolbar. 2. Select the device site from the list box on the toolbar. 3. Select RT Harmonic Monitor from the Monitor menu. Use the Poll button for a single-step poll or the button for continuous polling. To stop Continuous poll continuous polling, click on the Stop button .
Chapter 8 Retrieving and Storing Files Uploading Files on Demand Chapter 8 Retrieving and Storing Files Using PAS, you can retrieve recorded events, data and waveforms from your devices and save them to files on your PC in the Microsoft Access database format. Historical data can be uploaded on demand any time you need it, or periodically through the Upload Scheduler that retrieves data automatically on a predefined schedule, for example, daily, weekly or monthly.
Chapter 8 Retrieving and Storing Files Using the Upload Scheduler 6. If you wish to retrieve data starting with a known date, check the “From” box and select the start date for retrieving data. 7. If you wish to retrieve data recorded before a known date, check the “To” box and select the last date for retrieving data. 8. Click OK. Using the Upload Scheduler To setup the Upload Scheduler: 1. Select Upload Scheduler from the Logs menu. 2.
Chapter 8 Retrieving and Storing Files Using the Upload Scheduler 3. Click Browse and select a database for storing retrieved data, or type the name for a new database, select a directory where you want to save it, and then click OK. 4. Click Configure or double click on the site row. 5. Select a daily, weekly or monthly schedule, and adjust the start time. If you wish to upload data periodically in predefined intervals, click on “Periodic” and define the time period in hours and minutes. 6.
Chapter 8 Retrieving and Storing Files Retrieving EN50160 Statistics Files Suspending the Scheduler To suspend the Upload Scheduler, check the Suspend Scheduler box at right. To activate the Upload Scheduler, leave this box unchecked. Running the Scheduler on Demand You can run the scheduler at any time outside the schedule by checking the Start Now box at right. This is a one-time action. After uploading is completed, the Upload Scheduler un-checks this box automatically.
Chapter 8 Retrieving and Storing Files Viewing Files On-line Viewing Files On-line Sometimes, it is useful to review a particular piece of historical data on-line at the time you expect new events to appear in the log. PAS allows you to retrieve historical data from a particular log without storing it to a file. The data appears only in the window on your screen. You can save it manually to the database.
Chapter 8 Retrieving and Storing Files Exporting Files 2. Select the database and a waveform or data log table you want to export, and then click Open. 3. Select a directory where you want to store your exported files, type a file name that identifies your files, select a desired file output format, and then click on the Save button. The PQDIF files are commonly recorded in compressed format. If you do not want your files to be compressed, uncheck the Compress box before saving the file.
Chapter 8 Retrieving and Storing Files Exporting Files To automatically convert your waveform or data log tables into COMTRADE or PQDIF format: 1. Open the Upload Scheduler. 2. Highlight a desired device site with the left mouse button, and then click on the Export button. 3. Check the Enabled box for a data log or a waveform log table you want to automatically convert at the upload time. 4. Highlight the Record to… row for the selected table and click on the Browse button. 5.
Chapter 8 Retrieving and Storing Files Archiving Files Each table row is provided with the device identifier that you can define in the meter database (see Creating a New Site for your Meter). Archiving Files Microsoft Access databases tend to grow fast. Databases above 0.5 Gigabytes can drastically slow down file operations. To avoid enormous growing files, you can either periodically change the target database, or use the Upload Scheduler’s file archiver to automatically move older data to archives.
Chapter 9 Viewing Files and Reports Operations with Files Chapter 9 Viewing Files and Reports Operations with Files Files you read from the meters are stored in one or in a number of tables in the meter database. Sections of multisection files like waveforms, load profiles and PQ statistics files are stored in multiple tables – each file section in a separate database table. Opening a Database Table To open a database table: on the PAS toolbar, or 1. Click on the Open button select “Open...
Chapter 9 Viewing Files and Reports Viewing Options does not support this format, you may instruct PAS to drop milliseconds. To change the way PAS records and displays the timestamp: 1. Select Options from the Tools menu and click on the Preferences tab. 2. Select the preferred timestamp format. 3. Click OK. Working with Tables Selecting Font and Grid To change the table font or a type of the grid lines: 1. Click with right mouse button on the table, select Options and click on the Table tab. 2.
Chapter 9 Viewing Files and Reports Viewing Options Working with Graphic Windows Selecting Channels To select the channels you want to view on the screen, click on the graph window with the right mouse button, select “Channels...”, check the channels you want displayed, and then click OK. Checkboxes for channels that are not available in the present view are dimmed. Selecting Primary and Secondary Units Voltages and currents can be displayed in primary or secondary units.
Chapter 9 Viewing Files and Reports Viewing Options Set Marker, and then click on the point where you want to put the marker. You can also drag both markers with the mouse, or use the right and left arrow keys on your keyboard to change the marker position. Click on the graph pane to allow the keyboard to get your input before using the keyboard.
Chapter 9 Viewing Files and Reports Viewing Options To print a graph to a printer, click on the print button the toolbar, select a printer and click OK.
Chapter 9 Viewing Files and Reports Viewing the Event Log Viewing the Event Log The Event log contains time-tagged events related to configuration changes, resets, device diagnostics, and setpoint operations. The Event log is displayed in a tabular view, one event per row. Use the scroll bar to view the entire log contents. See Working with Tables for more information on viewing options.
Chapter 9 Viewing Files and Reports Viewing the Event Log Linking to Waveforms and Data Records If a setpoint is programmed for logging setpoint operation events and it could trigger waveform or data recording, PAS automatically establishes links between the event and other database records where it finds a relationship with the event. The event ID for which PAS found related data is blue colored. Click on the colored ID to check a list of the event links.
Chapter 9 Viewing Files and Reports Viewing the Power Quality Event Log Viewing the Power Quality Event Log The EN 50160 PQ event log stores individual time-tagged power quality events. The PQ log file is displayed in a tabular view, one event per row. Use the scroll bar to view the entire log contents. See Working with Tables for more information on viewing options.
Chapter 9 Viewing Files and Reports Viewing the Power Quality Event Log Linking to Waveforms and Data Records PQ events for which PAS found related links are blue colored. Click on the colored ID to check a list of the event links. Click on a list item to move to the related waveform or data log records. Data records associated with the event are taken into a separate window for easy viewing and trending.
Chapter 9 Viewing Files and Reports Viewing the Power Quality Event Log See Using a Zoom and Changing Region Size for information on how to change the graph scale to separate closely located elements.
Chapter 9 Viewing Files and Reports Viewing the Fault Log Viewing the Fault Log The Fault recorder stores time-tagged fault events. Fault log files are displayed in a tabular view. Use the scroll bar to see the entire log contents. See Working with Tables for more information on viewing options. Filtering and Sorting Events To filter events, click on the Filter button , or click on the report window with the right mouse button and select “Filter...
Chapter 9 Viewing Files and Reports Viewing the Fault Log Linking to Waveforms and Data Records When displaying the fault report, PAS establishes links between the event and related waveforms and data log records. Fault events for which PAS finds related links are blue colored. Click on the colored event ID with the left mouse button to check a list of the event links. Click on a list item to move to the related waveform or data log records.
Chapter 9 Viewing Files and Reports Viewing the Data Log Viewing the Data Log Data log files can be displayed in a tabular view, one data record per row, or in a graphical view as a data trend graph. Viewing Data Trend To view data in a graphical form, click on the Data Trend button on the local toolbar. To change the time range for your graph, click on the Time on the local toolbar, and then select the Range button desired date and time range.
Chapter 9 Viewing Files and Reports Viewing Waveforms Viewing Waveforms Waveforms can be displayed in five different views: as overlapped waveforms on a common time axis, individual waveforms using separate time axes, as a cycle-by-cycle plot of RMS values, as a frequency chart for voltage channels, and as a harmonic spectrum in a graph or in a table view. Each waveform window has a local toolbar from where you can open another window to examine the waveforms in a different view.
Chapter 9 Viewing Files and Reports Viewing Waveforms A waveform window displays up to 128 waveform cycles. If the waveform contains more cycles, the scroll bar appears under the waveform pane allowing you to scroll through the entire waveform. Scrolling through the Database The status bar at the bottom shows you how many records the database contains. Use green arrowheads to scroll through records.
Chapter 9 Viewing Files and Reports Viewing Waveforms Viewing a Frequency Plot Click on the button to view a cycle-by-cycle frequency plot for the sampled voltage waveforms. Viewing a Spectrum Chart button to view a spectrum chart for the Click on the selected waveform channel. PAS provides voltage, current, active power and reactive power spectrum charts. To change a channel, click on the window with the right mouse button, select “Channels...”, check the channel you want displayed, and then click OK.
Chapter 9 Viewing Files and Reports 174 Viewing Waveforms EM920 Power Quality and Revenue Meter
Chapter 9 Viewing Files and Reports Viewing Waveforms To review or change harmonic limits: 1. Click on the spectrum window with the right mouse button and select “Limits…”. 2. Select a harmonics standard, or select “Custom” and specify your own harmonic limits. 3. Check the Enabled box to visualize harmonic faults on the spectrum graph and in harmonic tables. Harmonics that exceed selected compliance levels are colored in red on the graph and in the tables.
Chapter 9 Viewing Files and Reports Viewing Waveforms Waveform Viewing Options See Working with Graphic Windows for more information on working with waveforms. Viewing Phasor Diagrams The phasor diagrams show you relative magnitudes and angles of the three-phase voltage and current fundamental component. All angles are shown relative to the reference voltage channel. To change the reference channel, click on the waveform window with the right mouse button, select “Options...
Chapter 9 Viewing Files and Reports Viewing Waveforms currents, calculated for the point indicated by the left marker line. To enable or disable the symmetrical components, click on the waveform window with the right mouse button, select “Options...”, check or uncheck the “Symmetrical components” box on the “Channels” tab, and then click OK. Viewing Synchronized Waveforms If you have a number of devices with synchronized clocks, you can view waveforms recorded at different locations in one window.
Chapter 9 Viewing Files and Reports Viewing Waveforms 4. Click on the “Channels” button and select channels for each site. 5. Click OK. To change the channels, click on the waveform window with the right mouse button and select “Channels...”.
Chapter 9 Viewing Files and Reports Viewing EN50160 Statistics Reports Viewing EN50160 Statistics Reports Viewing the EN50160 Compliance Report To get the EN50160 Compliance report, select “EN50160 Compliance Statistics” from the Reports menu, point to the database where you stored the retrieved statistics data, uncheck the voltage characteristics’ tables you do not want to be reported, and then click Open. An example of the EN50160 compliance report is shown in the following picture.
Chapter 9 Viewing Files and Reports Viewing EN50160 Statistics Reports Selecting the Time Range To change the time range or contents of the report, click on the report with the right mouse button, select “Options…”, select the required time range, check the voltage characteristics to be included in the report, and then click OK.
Chapter 9 Viewing Files and Reports Viewing EN50160 Statistics Reports Customizing Reports If you wish to add a logo image, header and footer to your reports: 1. Select “Report Setup…” from the Reports menu, or click on the report window with the right mouse button, and then select “Report Setup…”. 2. Click on the Change button and select a logo image file. Check the “Show” box to include your logo into a report. 3. Type the header text in the Page Header box.
Chapter 9 Viewing Files and Reports Viewing EN50160 Statistics Reports 5. Click OK. Both the header and the footer may contain more than one line of the text. Use the Enter button to move to the next line as usually. Viewing the EN50160 Online Statistics Report If you retrieved the EN50160 online statistics data, you can view the online report on the last retrieved statistics in the same manner as the EN50160 Compliance statistics report.
Appendix A Parameters for Monitoring and Logging Appendix A Logging Parameters for Monitoring and The following table lists all electricity and status parameters available for monitoring via communication ports, for data logging, and for triggering setpoints.
Appendix A Parameters for Monitoring and Logging Designation 184 Description MINUTES Minutes SECONDS Seconds MINUTE INTERVAL Minute interval: 1-5, 10, 15, 20, 30, 60 min SYMM COMP Symmetrical Components V PSEQ Positive-sequence voltage V NSEQ Negative-sequence voltage V ZSEQ Zero-sequence voltage V NSEQ UNB% Negative-sequence voltage unbalance V ZSEQ UNB% Zero-sequence voltage unbalance I PSEQ Positive-sequence current I NSEQ Negative-sequence current I ZSEQ Zero-sequence current
Appendix A Parameters for Monitoring and Logging Designation Description 8 PF L3 Power factor L3 V1 THD V1/V12 voltage THD 2,3 V2 THD V2/V23 voltage THD 2,3 V3 THD V3/V31 voltage THD 2,3 I1 THD I1 current THD 3 I2 THD I2 current THD 3 I3 THD I3 current THD 3 I1 KF I1 K-Factor 3 I2 KF I2 K-Factor 3 I3 KF I3 K-Factor 3 I1 TDD I1 current TDD 3 I2 TDD I2 current TDD 3 I3 TDD I3 current TDD 3 V12 V12 voltage V23 V23 voltage V31 V31 voltage RT LOW 1-Cycle Low Values
Appendix A Parameters for Monitoring and Logging Designation 186 Description 8 PF LEAD Total PF lead kW IMP Total kW import (delivered) 8 8 kW EXP Total kW export (received) kvar IMP Total kvar import (delivered) 8 8 kvar EXP Total kvar export (received) V AVG 3-phase average line-to-neutral/line-to-line voltage V LL AVG 3-phase average line-to-line voltage I AVG 3-phase average current RT AUX 1-Cycle Auxiliary Values I4 I4 current In In current FREQ Frequency V UNB% Voltage
Appendix A Parameters for Monitoring and Logging Designation Description V2x V2x phase-to-ground voltage V3x V3x phase-to-ground voltage AVR LOW 1-Second Low Values on any Phase V LOW Low line-to-neutral/line-to-line voltage I LOW Low current kW LOW Low kW kvar LOW Low kvar kVA LOW Low kVA PF LAG LOW Low lagging PF PF LEAD LOW Low leading PF THD LOW Low voltage THD 2,43 V THD LOW Low current THD 4 1 4 KF LOW Low K-Factor I TDD LOW Low current TDD V L-L LOW Low line-to-line
Appendix A Parameters for Monitoring and Logging Designation 188 Description V UNB% Voltage unbalance 6 I UNB% Current unbalance 6 V4x V4x neutral-ground voltage Temp Internal temperature RMS (0.2 sec) 0.
Appendix A Parameters for Monitoring and Logging Designation Description I2 I2 current I3 I3 current I4 I4 current In In current V ZERO-SEQ Zero-sequence voltage I ZERO-SEQ Zero-sequence current V UNB% Negative-sequence voltage unbalance I UNB% Negative-sequence current unbalance FREQ Frequency V PSEQ Positive-sequence voltage V ZSEQ UNB% Zero-sequence voltage unbalance HRM TOT (0.2 sec) 0.
Appendix A Parameters for Monitoring and Logging Designation 190 Description I2 TDD I2 TDD I3 TDD I3 TDD I4 TDD I4 TDD I1 KF I1 K-Factor I2 KF I2 K-Factor I3 KF I3 K-Factor I4 KF I4 K-Factor HRM TOT (10 min) 10-Minute Total Harmonics V1 THD V1/V12 THD 2 V2 THD V2/V23 THD 2 V3 THD V3/V31 THD 2 I1 THD I1 THD I2 THD I2 THD I3 THD I3 THD I4 THD I4 THD V1 THD/I V1/V12 interharmonics THD 2 V2 THD/I V2/V23 interharmonics THD 2 V3 THD/I V3/V31 interharmonics THD 2 I1 THD
Appendix A Parameters for Monitoring and Logging Designation Description I2 DMD I2 Ampere demand I3 DMD I3 Ampere demand kW IMP BD kW import (delivered) block demand kvar IMP BD kvar import (delivered) block demand kVA BD kVA block demand kW IMP SD kW import (delivered) sliding window demand kvar IMP SD kvar import (delivered) sliding window demand kVA SD kVA sliding window demand kW IMP ACD kW import (delivered) accumulated demand kvar IMP ACD kvar import (delivered) accumulated demand
Appendix A Parameters for Monitoring and Logging Designation ENERGY 192 Description Instrumentation Total Energy kWh IMPORT kWh delivered kWh EXPORT kWh received kWh NET kWh net kvarh IMPORT kvarh delivered kvarh EXPORT kvarh received kvarh NET kvarh net kvarh Q1 kvarh quadrant Q1 kvarh Q2 kvarh quadrant Q2 kvarh Q3 kvarh quadrant Q3 kvarh Q4 kvarh quadrant Q4 kVAh TOTAL kVAh total kVAh IMPORT kVAh delivered (Q1+Q4) kVAh EXPORT kVAh received (Q2+Q3) SUMMARY REGS Billing Summary
Appendix A Parameters for Monitoring and Logging Designation I3 %HD01 Description H01 Harmonic distortion I3 %HD02 H02 Harmonic distortion … ... I3 %HD50 H50 Harmonic distortion ANG V1 V1/V12 Harmonic Angles V1 H01 ANG H01 Harmonic angle V1 H02 ANG H02 Harmonic angle … ... V1 H50 ANG H50 Harmonic angle ANG V2 V2/V23 Harmonic Angles V2 H01 ANG H01 Harmonic angle V2 H02 ANG H02 Harmonic angle … ...
Appendix A Parameters for Monitoring and Logging Designation 194 Description kvar L2 H01 kvar L2 kvar L3 H01 kvar L3 8 8 kVA L1 H01 kVA L1 8 kVA L2 H01 kVA L2 8 kVA L3 H01 kVA L3 8 PF L1 H01 Power factor L1 8 PF L2 H01 Power factor L2 8 PF L3 H01 Power factor L3 8 HRM TOT POW Fundamental Total Power Values kW H01 Total fundamental kW kvar H01 Total fundamental kvar 8 8 8 kVA H01 Total fundamental kVA PF H01 Total fundamental PF FLICKER Flicker V1 Pst V1/V12 short-term
Appendix A Parameters for Monitoring and Logging Designation Description I1 TDD MIN I1 current TDD I2 TDD MIN I2 current TDD I3 TDD MIN I3 current TDD V12 MIN V12 voltage V23 MIN V23 voltage V31 MIN V31 voltage MIN TOTAL Minimum 1-Cycle Total Values kW MIN Total kW kvar MIN Total kvar 8 8 8 kVA MIN Total kVA PF MIN Total PF PF LAG MIN Total PF lag PF LEAD MIN Total PF lead MIN AUX Minimum 1-Cycle Auxiliary Values I4 MIN I4 current In MIN In current 8 8 8 FREQ MIN Frequen
Appendix A Parameters for Monitoring and Logging Designation 196 Description I3 TDD MAX I3 current TDD V12 MAX V12 voltage V23 MAX V23 voltage V31 MAX V31 voltage MAX TOTAL Maximum 1-Cycle Total Values kW MAX Total kW kvar MAX Total kvar kVA MAX Total kVA 8 8 8 8 PF MAX Total PF PF LAG MAX Total PF lag PF LEAD MAX Total PF lead 8 8 MAX AUX Maximum 1-Cycle Auxiliary Values I4 MAX I4 current In MAX In current FREQ MAX Frequency V UNB% MAX Voltage unbalance 6 I UNB% MAX
Appendix A Parameters for Monitoring and Logging Designation REG10 CMD Description Summary register #10 cumulative maximum demand TOU PRMS TOU Parameters ACTIVE TARIFF Active TOU tariff ACTIVE PROFILE Active TOU profile TOU REG1 Billing TOU Energy Register #1 REG1 TRF1 Tariff #1 register REG1 TRF2 Tariff #2 register … … REG1 TRF8 Tariff #8 register TOU REG2 Billing TOU Energy Register #2 REG2 TRF1 Tariff #1 register REG2 TRF2 Tariff #2 register … … REG2 TRF8 Tariff #8 register TO
Appendix A Parameters for Monitoring and Logging Designation REG10 TRF2 198 Description Tariff #2 register … … REG10 TRF8 Tariff #8 register TOU MAX DMD REG1 Billing TOU Maximum Demand Register #1 REG1 TRF1 MD Tariff #1 maximum demand REG1 TRF2 MD Tariff #2 maximum demand … … REG1 TRF8 MD Tariff #8 maximum demand REG1 TRF1 CMD Tariff #1 cumulative maximum demand REG1 TRF2 CMD Tariff #2 cumulative maximum demand … … REG1 TRF8 CMD Tariff #8 cumulative maximum demand TOU MAX DMD REG2
Appendix A Parameters for Monitoring and Logging Designation Description … … REG6 TRF8 MD Tariff #8 maximum demand REG6 TRF1 CMD Tariff #1 cumulative maximum demand REG6 TRF2 CMD Tariff #2 cumulative maximum demand … … REG6 TRF8 CMD Tariff #8 cumulative maximum demand TOU MAX DMD REG7 Billing TOU Maximum Demand Register #7 REG7 TRF1 MD Tariff #1 maximum demand REG7 TRF2 MD Tariff #2 maximum demand … … REG7 TRF8 MD Tariff #8 maximum demand REG7 TRF1 CMD Tariff #1 cumulative maximum d
Appendix A Parameters for Monitoring and Logging 6 The value is calculated using a simplified technique as a relation of the maximum deviation of phase values from a 3phase average value to a 3-phase average. 7 The value is calculated using a simplified technique as a one third of the RMS value of a 3-phase vector sum. 8 Not affected by loss compensation – always indicate readings at the metering point.
Appendix B Setpoint Parameters Appendix B Setpoint Parameters Setpoint Triggers For setpoint triggers, see Monitoring and Logging. Appendix A Parameters for Setpoint Actions The available setpoint actions are listed in the following table.
Appendix C Analog Output Parameters Appendix C Analog Output Parameters The following table lists parameters that can be provided on the meter analog outputs.
Appendix C Analog Output Parameters Designation Description 1-Sec Auxiliary Values In AVR In Current FREQ AVR Frequency kW IMP ACD Accumulated kW import demand kW EXP ACD Accumulated kW export demand kvar IMP ACD Accumulated kvar import demand Present Demands kvar EXP ACD Accumulated kvar export demand kVA ACD Accumulated kVA demand 1 In 4LN3, 4LL3, 3LN3 and 3LL3 wiring modes, the voltages are line-to-neutral; for any other wiring mode, they are line-to-line voltages.
Appendix D Billing and Load Profile Log Files Appendix D Billing and Load Profile Log Files The following tables show the record structure for the monthly and daily billing data profile and energy load profile log files. The second column shows data abbreviations used in the PAS data log reports. Data log file sections are highlighted in bold. Energy Load Profile Data Log (Data Log #12) Field No.
Appendix D Billing and Load Profile Log Files Field No. 2 Designation TIME0 Description Summary (total) max. demand timestamp 3 REG1 CMD Summary (total) cumulative max. demand 4 TRF1 MD Tariff #1 max. demand 5 TIME1 Tariff #1 max. demand timestamp 6 TRF1 CMD Tariff #1 cumulative max. demand 7 TRF2 MD Tariff #2 max. demand 8 TIME2 Tariff #2 max. demand timestamp 9 TRF2 CMD Tariff #2 cumulative max. demand 10 TRF3 MD Tariff #3 max. demand 11 TIME3 Tariff #3 max.
Appendix D Billing and Load Profile Log Files Field No. 24 Designation TRF7 CMD Description Tariff #7 cumulative max. demand 25 TRF8 MD Tariff #8 max. demand 26 TIME8 Tariff #8 max. demand timestamp 27 TRF8 CMD Tariff #8 cumulative max. demand The number of parameters in each section is automatically configured depending on the number of actual tariffs you defined in the TOU Daily Profiles Daily Billing Profile Data Log (Data Log #16) Field No.
Appendix D Billing and Load Profile Log Files Field No. Designation Description 8 TRF7 MD Tariff #7 max. demand reading 9 TRF8 MD Tariff #8 max. demand reading The number of parameters in each section is automatically configured depending on the number of actual tariffs you defined in the TOU Daily Profiles.
Appendix E EN50160 Statistics Log Files Appendix E EN50160 Statistics Log Files The following tables list the EN50160 evaluation parameters recorded by the device to the EN50160 statistics data log files. The second column shows data abbreviations used in the PAS data log reports. Data log file sections are highlighted in bold. EN50160 Compliance Statistics Log (Data Log #9) Field No.
Appendix E EN50160 Statistics Log Files Field No.
Appendix E EN50160 Statistics Log Files Field No.
Appendix E EN50160 Statistics Log Files Field No.
Appendix E EN50160 Statistics Log Files Field No.
Appendix E EN50160 Statistics Log Files Field No.
Appendix F EN50160 Evaluation and Recording Appendix F EN50160 Evaluation and Recording EN50160 Background The EN50160 European standard “Voltage characteristics of electricity supplied by public distribution systems” issued by CENELEC defines the main physical characteristics of electric energy supplied by low and medium voltage public distribution systems under normal operating conditions. The voltage characteristics are evaluated using a statistical approach.
Appendix F EN50160 Evaluation and Recording values, which are intended to provide users with information on the order of magnitude which can be expected. The following table gives the characteristics for which indicative values have been specified by the standard. Voltage Characteristic Indicative values Observation period Voltage dips Less than 1 s, 60% depth Year Short interruptions 70% less than 1 s Year Long interruptions 10 to 50% less than 3 min Year Temporary overvoltages Less than 1.
Appendix F EN50160 Evaluation and Recording clears the evaluation registers and counters so that each evaluation period’s statistics is stored in a separate record. You can upload and view the online statistics data via PAS reports, using data collected since the beginning of the present evaluation interval. You can also manually clear the present contents of the counters though PAS before starting your EN50160 evaluation.
Appendix F EN50160 Evaluation and Recording Supply Voltage Variations This characteristic defines slow variations of steady state supply voltage magnitude. Method of Evaluation The basic supply voltage magnitude measurement is the RMS value of the steady state voltage over a period of 10 minutes under normal operating conditions. A voltage variation is not evaluated if the supply voltage crosses a voltage tolerance limit (±15% Un).
Appendix F EN50160 Evaluation and Recording the supply voltage. Flicker is indicated by the long-term flicker severity parameter Plt, which is evaluated every 2 hours. Method of Evaluation The basic measurement is the short-term flicker severity indicator Pst, evaluated each 10 minutes by instrumentation complying with IEC 61000-4-15. The indicative long-term flicker severity Plt is evaluated from 12 consecutive Pst values.
Appendix F EN50160 Evaluation and Recording Indicative Values Under normal operating conditions the expected number of voltage dips in a year may be from up to a few tens to up to one thousand. The majority of voltage dips have a duration less than 1 s and a depth less than 60%. Voltage Interruptions Voltage interruptions correspond to temporary loss of supply voltage on all phases lasting less than or equal to 3 minutes in the event of short interruptions, and more than 3 minutes for long interruptions.
Appendix F EN50160 Evaluation and Recording The overvoltage threshold can be changed in the meter via the EN50160 PQ Recorder setup. The basic voltage measurement is one-cycle RMS voltage updated each half-cycle. Statistical Survey The EM920 provides the statistical evaluation of temporary overvoltages using the classification recommended by Eurelectric’s Measurement guide for voltage characteristics. Temporary overvoltages are classified by voltage magnitude and duration as shown in Appendix E.
Appendix F EN50160 Evaluation and Recording component expressed in percent of the positive sequence component. Voltage unbalance is not evaluated if the supply voltage crosses a voltage tolerance limit (±15% Un). Target Values The range of voltage unbalance given in the EN50160 is: ≤ 2% (≤ 3% in some areas) for 95% of a week The voltage unbalance compliance limit can be changed in the meter via the EN50160 PQ Recorder setup.
Appendix F EN50160 Evaluation and Recording distortion factor (THD) over a period of 10 minutes under normal operating conditions. Interharmonic voltages are evaluated by instrumentation complying with IEC 61000-4-7. All calculations are made relative to the nominal voltage. The highest harmonic order for evaluating individual interharmonic voltages and interharmonic THD can be selected in the meter in the range of 25 to 50 via the EN50160 Advanced setup.
Appendix F EN50160 Evaluation and Recording Signaling voltages are not evaluated if the supply voltage crosses a voltage tolerance limit (±15% Un). Target Values The voltage levels given by the EN50160 in Figure 1 of Clause 2.13 are taken from the so-called “Meister-curve” which defines the maximum permissible ripple control voltages in LV networks. Compliance with the EN50160 requires that the 3-second mean of signal voltages shall be less or equal to the specified limits for 99% of a day.
Appendix G Data Scales Appendix G Data Scales The maximum values for volts, amps and powers in EM920 setup and in communications are limited by voltage and current scale settings. See Device Options Mode Control in Chapter 5 on how to change the voltage current scales in your meter. the the and and The following table shows the meter data scales.
Appendix H Device Diagnostic Codes Appendix H Diagnostic Code Device Diagnostic Codes Display Message Description Reason 2 RAM/Data fault RAM/Data error Hardware failure 3 Watchdog reset Hardware watchdog reset Hardware failure 4 Sampling fault DSP/Sampling fault Hardware failure 5 CPU exception CPU exception Hardware failure 6 Run-time error Run-time error Hardware failure 7 SW watchdog reset Software watchdog timeout Hardware failure 8 Power down Power down Loss of power