
Technical information

4/9
Software
Unity Pro software
Small/Large/Extra Large
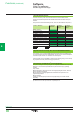
Debugging tools
Unity Pro software offers a complete set of tools for debugging Modicon M340,
M580, Premium or Quantum applications. A tool palette provides direct access to the
main functions:
b Dynamic program animation.
b Setting of watchpoints or breakpoints (not authorized in event-triggered tasks).
b Step-by-step program execution. A function in this mode enables section-by-
section execution. Instruction-by-instruction execution can be launched from the
previous breakpoint. Three execution commands are therefore possible when the
element to be processed is a subroutine (SR) or DFB user block instance:
v Step Into: this command is used to move to the rst element of the SR or DFB
v Step Over: this command is used to execute the entire SR or DFB
v Step Out: this command is used to move to the next instruction after the SR or
DFB element
b Independent execution of the master (MAST), fast (FAST), auxiliary (AUX) and
event-triggered (EVTi) tasks.
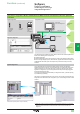
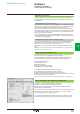
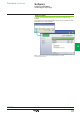
Animation of program elements
Dynamic animation is managed section-by-section. A button on the toolbar is used to
activate or deactivate animation for each section.
When the PLC is in RUN, this mode can be used to view simultaneously:
b The animation of a program section, regardless of the language used.
b The variables window containing the application objects created automatically
from the section viewed.
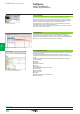
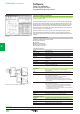
Animation table
Tables containing the variables of the application to be monitored or modied can be
created by data entry or initialized automatically from the selected program section.
The tables can be stored in the application and retrieved from there at a later date.
Unity Pro can be used to save, import and export Animation tables with predened
set values. As it allows population of set values along with current values and vice
versa in the PLC, the Animation tables can be used as templates to make the
application easier to tune.
Debugging DFB user function blocks
The parameters and public variables of these blocks are displayed and animated in
real time using animation tables, with the possibility of modifying and forcing the
required objects.
In exactly the same way as with other program elements, the watchpoint, breakpoint,
step-by-step execution and program code diagnostics functions can be used to
analyze the behavior of DFBs. Setting a breakpoint in a DFB user function block
instance stops execution of the task containing this block.
Debugging in Sequential Function Chart (SFC) language
The various debugging tools are also available in SFC language. However, unlike
other sections (IL, ST, LD or FBD) an SFC section executed step-by-step does not
stop execution of the task but instead freezes the SFC chart. Several breakpoints
can be declared simultaneously within a single SFC section.
Functions (continued)
Selection guide:
page 4/2
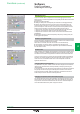
Dynamic animation/adjustment
Watchpoint
Breakpoint/step-by-step
2
1
3
4
5
6
7
8
9
10
2
1
3
4
5
6
7
8
9
10