
User manual


Ethernet Communication Services
33002479 06 07/2008 93
Bandwidth
Monitoring Load
Rates
The Bandwidth Monitoring service checks once a second and computes four (4)
values in private data. These values are returned as the percentage of the NOE’s
CPU that is allocated to:
z Global Data (see Global Data (Publish / Subscribe) Utility, p. 187)
z I/O scanner (see I/O Scanner, p. 199)
z Modbus messaging (see Modbus Messaging, p. 85)
z other services and idle
CPU time spent in other services is shown as "Other" or "Free." Bandwidth
Monitoring uses the same functions as used by SNMP.
The three service rates, Global Data, I/O Scanner, and Messaging, are computed
using the following formula:
(Current load * 100) / Maximum Load
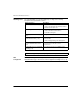
The table shows the (dynamically computed) Maximum Load Rate for the
NOE 771 x1:
Diagnostic Service Workload Data Returned Maximum Load
Global Data Number of published variables per second 800
I/O Scanner Number of transactions per second 4200
Messaging Number of messages treated per second 410
Note: The loads depend on controller scan times. Each application has an
expected scan time. Therefore, when evaluating loads, ensure that the controller
scan time is set to the expected scan time for the modeled application.