
Installation Guide
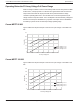
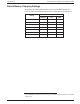
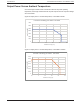

Table Of Contents
- Audience
- Safety Information
- Introduction
- Installation
- Troubleshooting
- Specifications

Output Power Versus Ambient Temperature
Once the charge controller’s heat sink reaches maximum full-power operating
temperature, the charge controller reduces its power output to ensure component ratings
are not exceeded.
Figure 20Output power vs. ambient temperature, Conext MPPT 80 600
0
1000
2000
3000
4000
5000
6000
7000
-20 0 20 40 60 80
max Power )W)
Ambient Temp (°C)
Thermal Dera!ng for MPPT 80-600
Figure 21Output power vs. ambient temperature, Conext MPPT 100 600
0
1000
2000
3000
4000
5000
6000
7000
-20 0 20 40 60 80
max Power )W)
Ambient Temp (°C)
Thermal Dera!ng for MPPT 100-600
Specifications Conext MPPT 80 and MPPT 100 Installation Guide
990-91319 This document is for use by qualified personnel 62