
Schneider Electric Conext Combox Owners Guide


Monitoring
4–6 975-0679-01-01 Revision E
temperature using the Battery Bank Daily Summary Plot. Individual plots for these
inputs are customizable and can be displayed or not displayed as required for
comparison purposes.
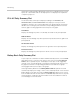
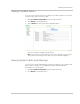
PV & AC Daily Summary Plot
The PV & AC Daily Summary Plot displays readings for Load Power, AC
Generator Power, and PV Harvest Power. The display for each plot can be
toggled by clicking on the corresponding title in the graph legend. Clicking the
title will cause it to be greyed out and the corresponding plot will be removed
from the graph. Clicking again will restore the plot to the graph.
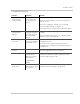
Load Power
Displays the wattage of power consumed by the loads for the period plotted.
Grid Net Power
Displays the total wattage of power exported or imported to/from the grid for the
period plotted.
AC Generator Power
Displays the wattage of power input from the generator for the period plotted.
PV Harvest Power
Displays the wattage of power input from all PV sources for the period plotted.
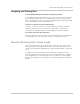
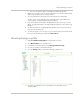
Battery Bank Daily Summary Plot
To plot a specific combination of data from different battery banks, use the Series
drop-down menus to select the four values to plot, then click the Plot Selected
Series button to update the plot. The display for each plot can be toggled by
clicking on the corresponding title in the legend. Clicking the title will cause it to
be greyed out and the corresponding plot will be removed from the graph.
Clicking again will restore the plot to the graph.
Selecting a Battery Bank from the Battery Bank to Plot drop-down menu will
automatically display the voltage, current, SOC, and temperature of the selected
Battery Bank for the date selected in the Date to Plot drop-down menu. If menu
items for different banks are selected from the Series drop-down menus, they will
automatically be changed to the bank number of the selected bank in order to
show readings for the entire bank.