Instruction Bulletin 63230-216-217/A2 9/2002 POWERLOGIC® Power Server PWRSRV710 and PWRSRV750 Models User’s Guide
NOTICE Read these instructions carefully and look at the equipment to become familiar with the device before trying to install, operate, or maintain it. The following special messages may appear throughout this bulletin or on the equipment to warn of potential hazards or to call attention to information that clarifies or simplifies a procedure.
63230-216-217/A2 9/2002 CONTENTS Contents CHAPTER 1—INTRODUCTION . . . . . . . . . . . . . . . . . . . . . . . . . . . . . . . . 1 Prerequisite Information Covered in the Power Server Setup Guide . . . . . 1 Terminology Used in this User’s Guide . . . . . . . . . . . . . . . . . . . . . . . . . . . . 1 Power Server Home Page . . . . . . . . . . . . . . . . . . . . . . . . . . . . . . . . . . . . . 2 CHAPTER 2—BASIC OPERATION . . . . . . . . . . . . . . . . . . . . . . . . . . . . .
Contents 63230-216-217/A2 9/2002 Using Reports . . . . . . . . . . . . . . . . . . . . . . . . . . . . . . . . . . . . . . . . . . . . . . 29 Creating Reports . . . . . . . . . . . . . . . . . . . . . . . . . . . . . . . . . . . . . . . . 29 Viewing Reports . . . . . . . . . . . . . . . . . . . . . . . . . . . . . . . . . . . . . . . . . 30 CHAPTER 4—SETTING USER PREFERENCES . . . . . . . . . . . . . . . . . . 31 Changing the Sample Rate . . . . . . . . . . . . . . . . . . . . . . . . . . . . . . . . . .
63230-216-217/A2 9/2002 CHAPTER 1—INTRODUCTION Introduction Prerequisite Information Covered in the Power Server Setup Guide The POWERLOGIC Power Server products provide access to real-time power system data using a standard web browser format. Two models are available—the PWRSRV710 and the PWRSRV750. The PWRSRV710 gives you access to real-time data and information.
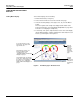
Introduction Power Server Home Page POWER SERVER HOME PAGE 63230-216-217/A2 9/2002 Figure 1 depicts the Power Server home page. All screens shown in this instruction bulletin depict the PWRSRV750 interface. NOTE: The Diagrams, Alarms, and Historical tabs do not display for the PWRSRV710 interface.
63230-216-217/A2 9/2002 CHAPTER 2—BASIC OPERATION Basic Operation Connecting to the Power Server User Interface Information in this chapter applies to both Power Server models. For operation procedures that apply to Model PWRSRV750 specifically, refer to Chapter 3—Power Server Model PWRSRV750 Operation on page 17.
Basic Operation Connecting to the Power Server User Interface 63230-216-217/A2 9/2002 2. Touch the welcome screen to launch the Power Server user interface. The Power Server Home page displays. If the touchscreen displays a black screen, simply touch the screen to bring the display out of sleep mode. Connecting to the Power Server from a Remote PC To connect to the Power Server from a remote PC, do the following: 1. Start Internet Explorer (version 5.5 or higher). 2.
63230-216-217/A2 9/2002 Basic Operation Refreshing (Reloading) the Power Server User Interface NOTE: The first time you connect to the Power Server, you will see a prompt asking you to install the POWERLOGIC Web Downloading Interface. Click Yes to install the control. You are only required to do this once for each remote PC. You must be logged on to your PC as an Administrator to do this.
Basic Operation Using Meter and Bar Chart Displays 63230-216-217/A2 9/2002 USING METER AND BAR CHART DISPLAYS Viewing Meter Displays To view meter displays, do the following: 1. Click the Meters tab (see Figure 2). 2. Select a device from the tree list on the left side of the page. 3. Select the desired quantity to view (amps, volts, etc.) from the Meters toolbar. The meters update at the sample rate displayed at the bottom of the Power Server Browser.
63230-216-217/A2 9/2002 Basic Operation Using Tables Viewing Bar Charts To view bar charts (Figure 3), do the following: 1. Click the Bar Charts tab. 2. Select a device from the list on the left side of the page. 3. Select the desired quantity to view (amps, volts, etc.). The bar charts update at the sample rate displayed at the bottom of the Power Server Browser. (See“Changing the Sample Rate” on page 32 for instructions on changing the sample rate.) 4.
Basic Operation Using Tables 63230-216-217/A2 9/2002 6. Double-click the Powerlogic Server icon on the desktop. 7. Enter master for both username and password. 8. Double-click the Powerlogic System Setup icon on the desktop. 9. Enter master for both username and password. 10. Click File > New > Quick Table. 11. Create the quick table. Select the Help > SMS-3000 Help > Custom Quantities and Tables > Adding a Custom (Quick) Table menu for instructions on creating quick tables. 12.
63230-216-217/A2 9/2002 Viewing Real-Time Tables Basic Operation Using Tables To view real-time tables, click the Tables tab. Two types of tables are available. Single Device Tables let you view data from a single device. MultiDevice Tables let you view summary data from multiple devices in the same table. Viewing a Single Device Table To view a single device table, do the following: 1. Click the Tables tab. 2.
Basic Operation Using Tables 63230-216-217/A2 9/2002 Viewing a Multiple Device Table To view a multiple device table, do the following: 1. Click the Tables tab. 2. Click the Multi-Device Tables button to display a list of available tables. 3. Select the desired table to view. The Power Server displays a dialog showing the list of devices that are compatible with the selected table (Figure 5). Figure 5: Multiple Device Tables selection list 4.
63230-216-217/A2 9/2002 VIEWING DOCUMENT FILES Basic Operation Viewing Document Files The Power Server can store document files onboard for convenient reference. For example, using the optional touch screen display, you can easily access stored reference documents at the equipment. Documents can be stored in either HTML format or Adobe Acrobat PDF format. When you view a PDF document, the Power Server launches the Adobe Acrobat Reader plug-in within the Power Server Browser.
Basic Operation Database Management 63230-216-217/A2 9/2002 DATABASE MANAGEMENT Two diagnostics pages are available to help you configure your Powerlogic System and manage the database of information that the Power Server collects. These pages are called the Database Growth Estimator page and the Database Statistics page. Database Growth Estimator The Power Server stores all logged data in a History database.
63230-216-217/A2 9/2002 Basic Operation Database Management 3. Select Database Growth Estimator from the list on the left side of the page. The Database Growth Estimator page displays. 4. Do the following: • In the Number of Logged Devices field, enter the number of devices you have set up in your system for logging. • Ιn the Number of Samples Per Day field, enter the total number of samples you have configured your Powerlogic System to acquire per day.
Basic Operation Database Management Database Statistics 63230-216-217/A2 9/2002 The Database Statistics page allows you to view the current status of the Power Server databases. From this page, you can tell when the Historical data is approaching the 100% capacity when it will begin deleting old data. To view the Database Statistics, do the following: 1. Click the Maintenance tab. 2. Click the Diagnostics button. The Diagnostics page displays. 3.
63230-216-217/A2 9/2002 Basic Operation Troubleshooting • Last FIFO Date: • When the History database reaches 100% capacity, the Power Server starts to run a “first in-first out” (FIFO) process. The Last FIFO Date displayed is the last date and time that the Power Server deleted one day’s worth of data. • Oldest Sample Date and Latest Sample Date: • These two dates represent the oldest and the most recent device data samples logged into the History database.
Basic Operation Troubleshooting 16 63230-216-217/A2 9/2002 © 2002 Schneider Electric All Rights Reserved
63230-216-217/A2 9/2002 CHAPTER 3—POWER SERVER MODEL PWRSRV750 OPERATION Power Server Model PWRSRV750 Operation Using Diagrams The Power Server Model PWRSRV750 has all the capabilities of the Power Server Model PWRSRV710 as well as additional functionality. This chapter covers these additional capabilities of the PWRSRV750. USING DIAGRAMS Creating Diagrams GFX-1000 is a color graphics program that lets you create diagrams for viewing real-time data from your Power Server PWRSRV750 user interface.
Power Server Model PWRSRV750 Operation Using Alarms 63230-216-217/A2 9/2002 14. Click the Diagrams tab. The new diagram should display in the tree list on the left side of the window. Refer to “Changing the Sample Rate” on page 32 for setting the sample rate that data updates in diagrams. The default sample rate is ten seconds. Viewing Diagrams To view diagrams, do the following: 1. Click the Diagrams tab. 2. Select the diagram from the list on the left side of the page. The diagram displays.
63230-216-217/A2 9/2002 Viewing Alarm Information Power Server Model PWRSRV750 Operation Using Alarms By default, the alarm icon is yellow and the alarm list is empty. When an alarm becomes active (alarm pickup state), the alarm icon (Figure 7) starts flashing and a new entry is added to the active alarm list and the alarm log list. This icon on the alarms tab alternately flashes red and yellow to indicate an active alarm.
Power Server Model PWRSRV750 Operation Using Alarms 63230-216-217/A2 9/2002 Viewing Active Alarms To view active alarms, click the Alarms tab and the Active Alarms page displays. See “Working with Trees on the Power Server User Interface” on page 36 for information on resizing, sorting, and getting details on entries. Viewing Detailed Information on an Alarm You can view detailed information on an active alarm as well as those in the alarm log. To do so, click the entry in the list for the alarm.
63230-216-217/A2 9/2002 Power Server Model PWRSRV750 Operation Using Alarms The Information Dialog displays. You can click the up and down arrows to scroll through information on alarms on the page you are viewing. NOTE: You can press Alt+N to go to the next alarm in the list. Press Alt+P to go to the previous.
Power Server Model PWRSRV750 Operation Using Alarms 63230-216-217/A2 9/2002 Retrieving Information from the Alarm Log To view a log of alarms, follow these steps: 1. Click the Alarms tab. The Alarms page displays. 2. Click the Alarm Log button. The Alarm Log displays. Click here to sort by waveforms. You have the following choices for how to view the alarm log: • Click All_Devices and then ALL ALARMS to view all alarms for all devices in the Power Server system.
63230-216-217/A2 9/2002 Power Server Model PWRSRV750 Operation Using Alarms view, the alarms are not updated. Watch for the refresh icon. The refresh icon will display anytime new entries have been added in the alarm log on the Power Server.
Power Server Model PWRSRV750 Operation Using Alarms 63230-216-217/A2 9/2002 3. Click the waveform icon. • If only one waveform is available for that alarm, then that waveform displays. • If multiple waveforms are available for the same alarm, the Waveform Selection Dialog displays. Click the type of waveform you want to view and make your selection from the list. Click OK. The waveform page displays. 4.
63230-216-217/A2 9/2002 Power Server Model PWRSRV750 Operation Using Alarms • 3—Click here to view two graphs—one with all three voltage phases overlapped and the other with all three current phases overlapped. • V/I—Click here to view each phase, both voltage and current, within a single graph. You see phase A voltage and current in one graph, phase B voltage and current in another, and phase C voltage and current in a third. • FFT—Click here to view the FFT cycle range.
Power Server Model PWRSRV750 Operation Using Waveforms 63230-216-217/A2 9/2002 3. Click the Scan Log. The Scan Log displays. USING WAVEFORMS Configuring Waveforms You can view waveforms in the Power Server user interface if they are uploaded on the Power Server. To configure waveforms to upload to the Power Server, refer to the Onboard Files and Onboard Alarms sections for the appropriate device types in Help > SMS-3000 Help > Setting Up Devices.
63230-216-217/A2 9/2002 Power Server Model PWRSRV750 Operation Using Waveforms 3. Choose a waveform for a particular device. Do the following: a. Click All_Devices or the group name that includes the device. b. Click the device that has information you want to view. c. Click the type of waveform you want to view. d. Select the appropriate time stamp. The waveform historical page for your selection displays.
Power Server Model PWRSRV750 Operation Using Waveforms 63230-216-217/A2 9/2002 Zooming for a Closer View of Waveforms with Associated Transients If you have a CM4000T in your system, you can click the square after zooming in on a specific phase to view the transient waveform associated with that waveform. If you have a CM4000T in your system, you can click the square after zooming in on a specific phase to view the transient waveform associated with that waveform.
63230-216-217/A2 9/2002 Power Server Model PWRSRV750 Operation Using Reports USING REPORTS Creating Reports You can use Information Manager, a module that is available in the system setup utility, to create historical reports on the Power Server. Follow these steps: NOTE: See “Prerequisite Information Covered in the Power Server Setup Guide” on page 1 if you are not yet familiar with operating the Power Server. 1. Use NetMeeting to access the Power Server. 2.
Power Server Model PWRSRV750 Operation Using Reports Viewing Reports 63230-216-217/A2 9/2002 To view reports, do the following: 1. Click the Historical tab. 2. Click the Reports button. 3. Select the desired report to be displayed. To do so, click the report name you want to view and then click the appropriate time stamp. The report displays. If a scheduled report is configured to overwrite, then only one date and time is listed under the report name.
63230-216-217/A2 9/2002 CHAPTER 4—SETTING USER PREFERENCES Setting User Preferences The Power Server provides several user-configurable preferences that you can set on the Preferences page. This chapter covers procedures for setting these preferences. It also covers other adjustments you can make for viewing information on screens. Unless otherwise noted, information in this chapter applies to both Power Server models.
Setting User Preferences Changing the Sample Rate CHANGING THE SAMPLE RATE 63230-216-217/A2 9/2002 By default, the Power Server samples data and updates real-time displays once every five seconds and data in diagrams once every ten seconds. The current sample rate is displayed in the lower left corner of the Power Server Browser’s window. To change the sample rate, do the following: 1. Click the Maintenance tab. 2. Click the Preferences button. The Power Server displays the Preferences page. 3.
63230-216-217/A2 9/2002 Setting User Preferences Changing the Default Page 3. Select Default Page from the tree on the left. The Default Page Preferences page displays. 4. From the Default Page Preferences page, make your selection. • If you select Meters or Bar Charts, the Default Device dialog displays. If you do not select a device, the default page is Meters or Bar Charts with no device selected.
Setting User Preferences Maximizing Screen Space for Viewing Data 63230-216-217/A2 9/2002 If you do not select a diagram, the default page is Diagrams with no diagram selected. If you select a diagram, that diagram starts sampling automatically when you display the default page. • No additional options display if you select Alarms (PWRSRV750 model only). 5. Make selections as needed from pulldown menus. 6. Click the Home tab to test your default configuration.
63230-216-217/A2 9/2002 Setting User Preferences How Alarms Are Indicated—Audible, Popup View, or Both Click here to expand the tree. Figure 9: HOW ALARMS ARE INDICATED— AUDIBLE, POPUP VIEW, OR BOTH Table in a Collapsed Tree View You can set alarms to make an audible sound when entering a pickup state. You can also have alarms display in a popup dialog that is visible anywhere you browse in the user interface. To select the method that alarms are indicated, do the following: 1.
Setting User Preferences Number of Alarm Records Displayed NUMBER OF ALARM RECORDS DISPLAYED 63230-216-217/A2 9/2002 You can choose how many alarm records to display when you view the Alarm Log. To do so, follow these steps: 1. Click the Maintenance tab. 2. Click the Preferences button. The Power Server displays the Preferences page. 3. Select Alarm Configuration from the list on the left side of the page. The Alarm Configuration dialog displays. Select the number of alarm log records to display. 4.
63230-216-217/A2 9/2002 Setting User Preferences Working with Lists on the PWRSRV750 Power Server User Interface WORKING WITH LISTS ON THE PWRSRV750 POWER SERVER USER INTERFACE This section covers procedures for using lists on the Power Server Model PWRSRV750. Resizing Columns in the Active Alarm Popup Window You can drag the borders of columns in the popup window to resize them. You can resize the columns to fit the longest entry for that particular column. To do so, follow these steps: 1.
Setting User Preferences Working with Lists on the PWRSRV750 Power Server User Interface 38 63230-216-217/A2 9/2002 © 2002 Schneider Electric All Rights Reserved
63230-216-217/A2 9/2002 INDEX Index A active alarm, 19 flashing, 19 alarm icon, 19 alarm log retrieving information, 22 scan utility device entries, 25 viewing system information, 25 viewing waveform information, 23 Alarm Log Refresh Icon, 22 alarms active alarms page, 23 Alt+N for next in list, 21 Alt+P for previous in list, 21 configuring, 18 diagrams, 25 disk, 25 memory, 25 page, 22 popup, 21 reports, 25 silencing, 19 viewing active, 20 viewing detailed information, 20 waveforms, 25 All Charts button,
63230-216-217/A2 9/2002 Index preferences, 31 remote PC, 31 touchscreen display, 31 tree configuration, 34 PWRSRV710, 1 PWRSRV750, 1, 17, 32, 37 Q quick tables creating, 17 R real-time tables, 9 report creation wizards, 29 reports overwriting, 30 viewing, 30 residual current, 24 resizing window, 36 RMS plot, 25 run mode, 1 V voltage phases, 24 W waveform column, 22 waveform dialog toolbar, 24 waveform historical information, 27 waveform icon, 23 waveform information viewing, 26 waveform page, 24 web d
POWERLOGIC® Power Server Setup Guide Schneider Electric Technical Support Contacts / Schneider Electric contactos de soporte técnico / Schneider Electric contacts pour l’assistance technique For technical support and additional information, contact your local sales office or an office listed below. / Para obtener soporte técnico e información adicional, póngase en contacto con su oficina local de ventas o con una de las oficinas que aparecen a continuación.