
Conext Gateway Installation
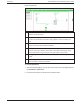


Figure 24 Dashboard
1
Power flow tab–shows an interactive and graphical view of the power plant with its
different connected devices.
2
Battery summary tab–shows a historical line graph of four battery metrics such as
current, volts, temperature, and state-of-charge (SOC). It shows one battery at a
time.
3
Battery comparison tab–shows a historical and comparative line graph of the four
battery metrics against all the different batteries.
4
Energy tab–shows a chronological summary of energy that is produced by three
sources; solar, grid, and battery. Also shows a chronological summary of energy
that is output to four energy consumers; load, grid, battery, and generator.
5
Energy comparison tab–shows a comparative graph between energy input and
output.
6
Main display board–shows the different graphical elements of the power plant, the
devices, battery, and energy information.
To view the dashboard:
1. After successfully logging in, the very first view to show on the main display board is
the Dashboard - Power Flow.
2. Click each of the tabs on the left to switch to different views.
Monitoring Conext Gateway Conext Gateway Owner's Guide
975-0806-01-01 50