
User guide


CUEMIX FX
75
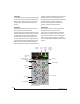
Using the full window filter display
Choose Show Full Window Analysis from the Filter
display options menu (Figure 10-10) to fill the
entire CueMix FX window with the filter EQ
display for detailed inspection and adjustment of
the EQ filter, as shown in Figure 10-16.
You can show and hide the FFT display,
spectrogram or EQ band response curves as
desired using the Display Options menu options
(Figure 10-16). These settings are independent of
the small graph display options (Figure 10-10), so
you have the flexibility to display different
combinations in each graph.
Show X-Axis Linear Scale
Check the Show X-Axis Linear Scale option in the
Display Options menu (Figure 10-16) to display
frequency on a linear scale, instead of the default
logarithmic scale. With a linear scale (checked),
frequency is constant, but the width of each octave
along the x-axis is different. With a logarithmic
scale (unchecked), octaves are displayed with a
constant width, but frequency is displayed
logarithmically within each octave.
The info box
The Show Info Box item in the full graph display
options menu (Figure 10-16) lets you display the
coordinates of any EQ filter point as you drag it in
the graph (Figure 10-17):
Figure 10-17: The Info Box.
The info box includes the industry standard
scientific note (pitch) name when the control point
is located at a frequency that resides within a
prescribed note range, where C4 is middle C. The
note number is accompanied by the number of
cents (±50) above or below the exact frequency for
the note. If the control point is dragged outside the
note range, only the frequency is shown.
Figure 10-16: Full window filter display.
Display
options
menu