
User guide


CUEMIX FX
88
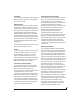
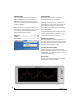
DEVICES MENU
If you are working with more than one MOTU
audio interface product, this menu displays all
interfaces that are currently on line. Choose any
device from the menu to edit its settings using the
CueMix FX software.
Below each device are three signal analysis tools:
Oscilloscope, X-Y Plot and Phase Analysis. Choose
one to open its window. For details on these
features, see the following sections.
Oscilloscope . . . . . . . . . . . . . . . . . . . . . . . . . . . . . . . . . . . . . . . . . 88
X-Y Plot . . . . . . . . . . . . . . . . . . . . . . . . . . . . . . . . . . . . . . . . . . . . . . 94
Phase Analysis . . . . . . . . . . . . . . . . . . . . . . . . . . . . . . . . . . . . . . . 97
Figure 10-32: Opening the oscilloscope, X-Y Plot and Phase Analysis
windows.
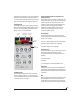
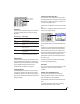
OSCILLOSCOPE
The Oscilloscope (Figure 10-33) graphs the
amplitude of an audio signal over time.
Amplitude is displayed on the y-axis and time is
displayed on the x-axis. A thick white vertical line
marks where time equals zero; a thick white
horizontal line marks where amplitude equals zero
(Figure 10-33, below).
Level meters are displayed to the right of the graph.
One or two meters are shown, depending on the
current view mode (see “View controls”).
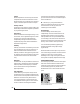
Opening the oscilloscope
Each mk3 series FireWire audio interface has its
own oscilloscope. To open an oscilloscope, choose
the Oscilloscope item from the Devices menu under
the desired interface (Figure 10-32).
Choosing a channel to display
The oscilloscope follows the currently focused
audio input or output. If you focus a mono channel
(e.g. Analog 3), its corresponding stereo pair will
be displayed (Analog 3–4).
View controls
The View controls (Figure 10-34) provide several
options for the oscilloscope display.
Figure 10-33: Oscilloscope