
User guide


CUEMIX FX
93
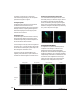
screen, try raising the Holdoff level. Once the
transient is settled in the display and fairly stable,
you may need to adjust the horizontal position to
center it in the display. These settings are depicted
in the example in Figure 10-39.
You can also pause the display at any time and
adjust the horizontal bounds to locate a transient.
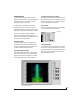
Clip detection
You can use the Oscilloscope to detect clipping in a
digital audio signal. To do so, enable all criteria
(Figure 10-37 on page 90), choose Single Sweep
from the trigger menu (Figure 10-37), set the level
to 0.999 and click the trigger indicator
(Figure 10-37) to arm it (yellow). As soon as the
signal clips, the trigger indicator will turn red, and
the display will show the offending clip at the line
marking time equals zero.
Viewing timing pulses
If you have two audio signals with recognizable,
timed pulses in them, and you wish to compare
their timing with respect to each other, you can use
Split Screen or Shared view to visually compare the
timing of the two signals. You can zoom in to the
sample level for sample accurate viewing.
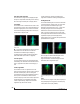
Building synthesizer patches
If you are building a synth patch on a synthesizer
(or forming similar highly periodic audio
material), you can run the audio signal through the
Oscilloscope as you adjust its sound to check in real
time for undesirable (and possibly inaudible)
characteristics, which are easily seen in the
Oscilloscope display. A good example is DC offset.
If a signal develops DC offset, the apparent vertical
center of its overall waveform will drift above or
below the line marking amplitude equals zero. Try
setting Waveform Recognition to Type I and setting
Trigger to None.
Another example is waveform polarity. If you are
combining several raw waveforms, polarity is a
critical, yet not always obvious, factor in
determining the resulting sound. You can use the
Oscilloscope to easily view and compare polarities
to see if they are inverted from one another or not.
The Add and Subtract L - R View menu settings are
particularly useful here.
You can also use the Oscilloscope to help you apply
waveform modulation and keep it “in bounds”. For
example, you could easily see if pulse width
modulation is collapsing in on itself to choke the
sound, an effect that is readily seen in the
Oscilloscope display but not necessarily easy to
determine by ear when using multiple modulation
sources.
Guitarists can also visually observe the effects of
their pedals and processing, while playing. With
the Trigger mode set to None and Waveform
Recognition set to Type I, the waveform will be
tracks automatically.
When applying filters and filter resonance, the
visual effect on the waveform can be invaluable in
reinforcing what you are hearing as you make
adjustments.
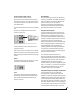
Monitoring control voltage output from Volta
MOTU’s Volta instrument plug-in for Mac OS X
turns your audio interface into a control voltage
interface, giving you precise digital control from
your favorite audio workstation software of any
hardware device with a control voltage (CV) input.
The CV signals output from Volta can be
monitored in the Oscilloscope, giving you visual
feedback on LFOs, envelopes, ramps, step
sequencers, and more.
For more information on Volta, see
www.motu.com.