
User guide


CUEMIX FX
94
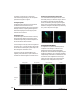
X-Y PLOT
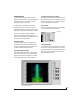
The X-Y Plot window (Figure 10-40) graphs the
amplitude of a stereo audio signal on a two-
dimensional grid.
For each unit of time (i.e. each sample), the
amplitude of the left channel is displayed on the x-
axis and the amplitude of the right channel is
displayed on the y-axis. A thick white vertical line
marks where left channel amplitude equals zero; a
thick white horizontal line marks where right
channel amplitude equals zero (Figure 10-40,
below). There are also thick white diagonal lines
for y = x and y = -x.
Metering
Level meters are displayed above and to the right of
the graph for the left (green) and right (red)
channels, respectively. An additional Correlation
meter (blue) is displayed on the right. This meter
displays the correlation between the two channels.
The higher the meter, the higher the correlation
between the two channels. Below are a few
examples:
Opening the X-Y Plot
Each mk3 series FireWire audio interface has its
own X-Y Plot window. Choose the X-Y Plot item
from the Devices menu under the desired interface
(Figure 10-32 on page 88).
Figure 10-40: X-Y Plot
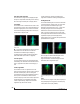
Situation Meter
level
X-Y Plot graph Mathematical
relationship
Perfect
correlation
+1 Diagonal line going
from lower left to
upper right:
y = x
Zero
correlation
0 No discernible pat-
tern
None
Perfectly out
of phase
-1 Diagonal line going
from upper left to
lower right:
y = -x