
User guide


CUEMIX FX
95
Choosing a channel pair to display
The X-Y Plot follows the currently focused audio
input or output. If you focus a mono channel (e.g.
Analog 3), its corresponding stereo pair will be
displayed (Analog 3–4).
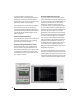
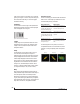
View controls
The View controls (Figure 10-41) provide several
options for the X-Y Plot display.
Figure 10-41: View controls
Pausing the display
The Pause button in the upper right corner of the
View section (Figure 10-41) allows you to freeze
the display at any time. To resume, click the button
again. The level meters will remain active while the
display is paused.
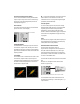
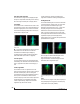
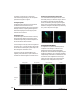
Line/Scatter
Choose either Line or Scatter from the menu in the
View section (Figure 10-41) to plot each point
(sample) as either a single pixel or as a continuous
line that connects each plot point to the next, as
shown below in Figure 10-42.
Figure 10-42: The same X-Y Plot displayed in Line versus Scatter
mode.
☛ Line mode is significantly more CPU intensive
than Scatter. You can reduce Line mode CPU
overhead on the X-Y Plot by reducing the Length
parameter (described below).
Color/Grayscale
In Color mode (Figure 10-41) the most recently
displayed audio data is shown in red, which fades
to yellow, green and then finally blue, before
disappearing. In Grayscale mode, data is first
shown in white and then fades to gray. To adjust the
scale of this color/brightness change, see “Decay”
on page 96.
Axes
The Axes control (Figure 10-41) sets the opacity of
the grid displayed in the graph, from 100% (fully
visible) down to 0% (fully hidden).
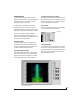
Horizontal and vertical controls
The Horizontal and Vertical controls
(Figure 10-43) configure the value range of the x-
axis (left channel amplitude), and y-axis (right
channel amplitude), respectively. Click and drag
the values up or down to set them, or double-click
to return to the default value.
There are two modes for the controls: Zoom/Offset
and
Min/Max. To change the mode, use the menu
shown in Figure 10-43.
Figure 10-43: Setting the Horizontal or Vertical control modes.
In Zoom/Offset mode, Zoom scales the axis. Pos
moves the lines marking x = 0 left and right, or y =
0 up and down.
Pause button