
User guide


CUEMIX FX
99
Horizontal and vertical controls
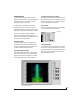
The Horizontal and Vertical controls
(Figure 10-51) let you scale each axis of the grid
and offset its zero point. Click and drag the values
up or down to set them, or double-click to return
to the default value.
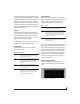
There are two modes for the controls: Zoom/Offset
and
Min/Max. To change the mode, use the menu
shown in Figure 10-51.
Figure 10-51: Setting the Horizontal or Vertical control modes.
In Zoom/Offset mode, Zoom scales the axis. Pos
moves the zero line.
In Min/Max mode, Min and Max let you scale the
grid by moving the end points along the axis. Min/
Max mode lets you set the boundaries of the graph
directly.
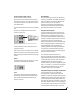
Filters
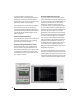
The Filters section (Figure 10-52) lets you control
the density of the Phase Analysis display.
Figure 10-52: Filters
Floor
Floor (Figure 10-52) determines the amplitude
threshold for the display. When the amplitude of
both channels drops below this threshold, the
signal is not shown.
Max delta theta
Max delta theta (Figure 10-52) only affects Line
view (see “Line/Scatter” on page 98) and sets the
maximum difference in frequency between plot
points in the line plot. For two adjacent
frequencies, if the distance (phase difference)
between the two frequencies is greater than the
Max delta theta, then the line is not drawn.
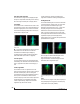
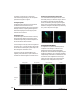
Using the Phase Analysis
In the polar display (top row of Figure 10-53 on
page 100), stereo material that is predominantly
phase-aligned (correlated) appears along the
vertical axis, as demonstrated in the first column
(Perfectly in phase) in Figure 10-53. If the vertical
line tilts left or right, this indicates general
differences in phase; the more the tilt (delta theta),
the more the phase difference. If the vertical line
points downwards in the polar display, this
indicates that the stereo image is predominantly
out of polarity, as demonstrated by the fourth
column (Inverted) in Figure 10-53. Delays appear
as spirals in the polar display.
The rectangular display (bottom row of
Figure 10-53) also shows a predominantly phase-
aligned stereo image along the vertical axis, and tilt
(or left-right offset) from the center vertical axis
represents differences in phase. If a signal is
predominantly out of polarity, it appears along the
theta = -1.0 or theta = +1.0 lines in the rectangular
display, as demonstrated in the fourth column
(Inverted) in Figure 10-53 on page 100.
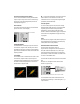
Using Phase Analysis for multiple mic placement
The polar display can be very useful when
recording drums or another instrument with
multiple microphones. The slight delays caused by
the differences in distance to the source can often
create a comb filtering (delay) effect between two
mic signals, due to phase cancellation. These comb
filter effects appear as spirals in the polar display. If
you arrange the mics so that the null points (where
the spiral pattern meets the negative y axis) are