
User's Manual


ISO 9001:2000 Cert. N°4500/1
Version 1.1 SDT_ARK6_User_Manual_ENG_vATSC Page 73 of 206
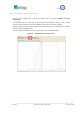
5.9.1.3 Complex Filter coefficients graph
The Complex Filter coefficients graph shows the current coefficients values. The circles indicate the real
part of coefficients; the red crosses indicate the imaginary one.
Figure 32. Filter window: complex filter coefficients graph
5.9.1.4 Module graph
The Module graph shows the actual output signal module according to the complex filer coefficients
applied.
Figure 33. Filter window: module graph
5.9.1.5 Phase graph
The Phase graph shows the actual output signal phase according to the complex filer coefficients
applied.
Figure 34. Filter window: phase graph