
System information


9707D-70 C-Band TXRX Maintenance and Troubleshooting
7-13
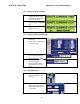
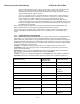
Level cage alignment Verification (sensor
alignment)
DISPV (Ref) Targeting
Stabilization
Rate Sensor Output Verification DISPW (Rate) Stabilization
Level and CL fine balance Verification DISPTC (Drive) Stabilization
AZ Friction Torque Test DISPTC (Drive) Stabilization
DishScan Drive/Phase DishScan XY Tracking
Stabilization
7.7.4.
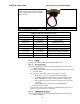
The DacRemP DISPIVC graph chart provides a means for monitoring the accumulated velocity errors of the
antenna for diagnostic purposes. If this error is excessive, it indicates external forces are acting on the
antenna. These forces may be the result of but not restricted to static imbalance, excessive bearing friction,
cable binding, or wind loading. If these forces cause the antenna to mis-point by more than 0.5° from the
desired position the PCU will flag a “Stab Limit” error.
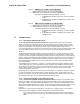
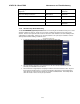
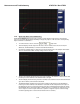
Antenna Loop Error Monitoring
• To view the position error, select the graph chart.
• This chart displays sensed axis errors via three traces, CL (Cross Level), LV (Elevation), and AZ
(Azimuth), at a fixed 0.05º/ vertical division.
• The normal trace average will plots it’s display ± 3 divisions from the red reference line. Any trace
line average plotted above this is of concern and troubleshooting required. The example below
shows the forces exerted onto the antenna as a resultant of DishScan Drive. The example below
shows the results of various forces put upon antenna.