SARK-110-ULM Vector Impedance Antenna Analyzer User’s Manual Revision 1.0 Updated to Firmware Version 1.0 This document is licensed under a Creative Commons Attribution-NonCommercial-ShareAlike 3.0 Unported License.
SARK-110-ULM User’s Manual Contents 1 2 3 INTRODUCTION....................................................................................................................... 4 1.1 OVERVIEW ........................................................................................................................... 4 1.2 MAIN FEATURES................................................................................................................... 5 1.3 PRECAUTIONS ....................................
SARK-110-ULM 4 User’s Manual SPECIAL FUNCTIONS ........................................................................................................... 41 4.1 TRANSMISSION LINE ADD/SUBTRACT .................................................................................. 41 4.2 CIRCUIT MODELS ............................................................................................................... 42 4.2.1 Loop Antenna/Coil ....................................................................
SARK-110-ULM User’s Manual 1 Introduction 1.1 Overview The SARK-110-ULM antenna analyzer is a multipurpose, precision instrument capable of analyzing antennas or networks, generating or detecting signals and performing Time-DomainReflectometry (TDR) measurements on transmission lines, in a frequency range between 0.1 and 160 MHz and up to 700 MHz with reduced performances.
SARK-110-ULM 1.2 User’s Manual Main Features • Low cost • Solid aluminum pocket size case and lightweight • Monochrome graphics display 128 x 64 pixels • Frequency range from 0.
SARK-110-ULM 1.3 User’s Manual Precautions 1. Never connect the unit to an antenna during a lightning storm and windy dry days. Lightning strikes and static discharges can damage the unit and may kill the operator. 2. Static build-up on an antenna may cause damage to the unit when connected.
SARK-110-ULM User’s Manual Even storing a battery in a hot environment can damage it irreversibly. When using your device in a very cold environment, you may notice a decrease in battery life, but this condition is temporary. Once the battery’s temperature returns to its normal operating range, its performance will return to normal as well.
SARK-110-ULM User’s Manual Place only discharged batteries in a battery collection container. If the connector is removed or the cable cut, use electrical tape or other approved covering over the battery connection points to prevent short circuits. 5) Properly handle the battery Please note the below safety precautions when handling the device internal battery: • Do not disassemble, crush, or puncture a battery. • Do not short the external contacts on a battery.
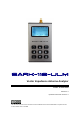
SARK-110-ULM User’s Manual 2 Operating the SARK-110-ULM Power Switch Test Port (SMA) Return Menu Enter Run/Hold Setup Micro USB Port Charger LED The SARK-110-ULM includes nine function buttons on the front side. The device under test can be connected to the Test Port, which is a SMA receptacle located on the top side. This receptacle accepts SMA plug connector types.
SARK-110-ULM User’s Manual Upon the first start, SARK-110-ULM goes to Scalar mode automatically. Operational mode and configuration settings are preserved automatically between sessions, stored in internal memory. 2.1 Changing the Operational Mode Press the Menu [ ] button twice to get into the Operational Mode select menu -pressing the Menu button toggles between the Function and Operation mode menus.
SARK-110-ULM User’s Manual The selected function is persistent, and it is shown on the left side of the screen. For instance, the screenshot below shows the selected Center function: “CENT”. The operation of Enter [ ] and up and down arrow buttons is associated to the selected function, so in this case if the Enter [ ] button is pressed the center frequency dialog will pop up, or if the up or down arrow buttons are pressed the center frequency will be changed. 2.
SARK-110-ULM 2.4 User’s Manual Using the Frequency Presets The analyzer provides predetermined frequency and span settings including the amateur radio bands and other suitable settings. Press the Menu [ ] button to select «Preset» in the Function menu. If «Preset» mode is already selected, press the Enter [ ] button. Press the up or down arrow buttons to highlight the desired preset. Press the Enter [ ] button to validate the preset selection. Press any other button to cancel the operation. 2.
SARK-110-ULM User’s Manual In manual marker mode “MAN”, press the left or right arrow buttons to change the marker position. Press the Menu [ ] button and select «Marker» to get into the marker menu. Available options are: «Tracking» for selecting the tracking mode, «Info» to display detailed information and «Center» to set the center frequency at the marker position. The automatic tracking feature makes positioning of the marker easier, thus helping the user to speed up measurements. Rev 1.
SARK-110-ULM User’s Manual The following tracking modes are available and can be set for any parameter. A detection value must be specified for the Cross-detection modes. • Disable • Peak Min (p) • Peak Max (P) • Absolute Min (m) • Absolute Max (M) • Value Cross Any (X) • Value Cross Up (^) • Value Cross Down (v) For example, to have the marker tracking automatically the minimum VSWR value, select «Marker» «Tracking» «Min», “Parameter” «VSWR». Rev 1.
SARK-110-ULM User’s Manual Another example, to have the marker tracking automatically the crossovers on the 50-ohm impedance, select «Marker» «Tracking» «Cross Any» «Parameter» «|Zs|», «Value» «050.00». The «Info» option displays detailed information of the readings at the marker position. Rev 1.
SARK-110-ULM User’s Manual The «Center» menu option can be used to set the center frequency at the marker frequency value. 2.7 Changing the Parameter Press the Menu [ ] button and select «Param» menu option to select the parameter to be plotted in Scalar Chart mode. Rev 1.
SARK-110-ULM User’s Manual If the function “PARAM” is selected, the plotted parameter can be quickly changed by pressing up or down arrow buttons. 2.8 Saving and Recalling Measurements The SARK-110-ULM has the capability to store measurements to the internal disk and recall them either to review the data later in the analyzer screen or to download the data from the USB disk to a PC for further analysis using SARK Plots or the ZPLOTS Excel application, available from http://www.ac6la.com/zplots.html.
SARK-110-ULM User’s Manual «Load Data» To retrieve the stored data, select the «Load Data» menu option. Select the file using the up or down arrow keys. Press the Enter [ ] button to validate the selection or the Return [ ] button to cancel. «Delete File» Use the «Delete file» option to delete a single file on the device disk. When selecting the «Delete File» option a popup submenu will be displayed with the list of available files. Select the file to delete using the up or down arrow keys.
SARK-110-ULM User’s Manual «Deep Sweep» The Deep Sweep save function provides the capability of saving measurements with arbitrary number of frequency points. In addition, this function enables a user programmable timeout for the automatic start of measurements to be specified. This function is similar to the self-timer function on cameras.
SARK-110-ULM Specify an optional delay for User’s Manual the automatic start of the measurements (self-timer function). When a Delay is specified, a countdown will commence. Otherwise, press the Enter [ ] button button to continue. After completing the sweep scan, the analyzer will save the results of the sweep scan to the file. Notice that the scan time is much longer than usual due to the higher accuracy setting and the additional number of points. Press the appropriate button to continue. 2.
SARK-110-ULM User’s Manual «Setup - Calibration» The calibration features are accessible through the Calibration submenu: «Setup – Calibration - OSL» See Appendix D: «Setup – Calibration - Frequency» See Appendix E: «Setup – Detector» See Appendix F: «Setup – Calibration - Profile» See Appendix D: «Setup – Run Mode» The Run Mode setup menu option allows setting «Continuous» or «Single Shot» sweep modes.
SARK-110-ULM User’s Manual condition the power consumption is reduced, so using single-shot mode helps to increase the battery autonomy. «Setup - Scale» The SARK-110-ULM provides three pre-defined scale values: Normal, High and Low as well as Auto (automatic scaling). This setting defines the maximum and minimum values for each parameter on the Y axis, see Appendix H:. This setup is valid for the Scalar Chart mode. «Setup - Z0» This setup permits the reference characteristic impedance to be changed.
SARK-110-ULM User’s Manual This setup permits the Automatic Power Off delay to be selected from a set of predefined times. After power-off, press the Run/Hold [ ] button to resume operation. Alternatively, power off and power on the device using the Power Switch. «Setup - Cable Type» The length measurements in the cable test mode and transmission line operations require the proper setting of the cable type.
SARK-110-ULM User’s Manual measurement speed. The «Double/Slow» option is intended for enhanced accuracy measurements, because it reduces measurement ripple by doubling the number of samples taken, but at the expense of a slower sweep speed. This enhancement of the measurements is more noticeable when using automatic scales for measurement over a small range of values. «Setup – Buzzer» This setup enables control of the analyzer’s sounds. Select «Enabled» to enable all the sounds.
SARK-110-ULM User’s Manual «Setup – Units» This setup allows configuration of distance units either in meters or feet. «Setup – Points TDR» Changes the number of sample points for Cable Test (TDR) function. Reducing the number of points speeds up the scan speed but at the expenses of decreasing the resolution of the measurements. «Setup – Reset Factory» This setup permits resetting the analyzer to its default settings. The internal disk drive can be optionally formatted.
SARK-110-ULM User’s Manual It is recommended that the disk contents are backed up to a PC as most of the files will be lost during the format. Only the Detector Calibration file (detcalib.dat) and the file associated with the selected OSL Calibration profile are preserved. «Setup – About» The About screen displays copyright information, firmware release number and date, disk volume name, disk size and free space, and battery level or USB if connected to a USB interface. Rev 1.
SARK-110-ULM User’s Manual 3 Operating Modes 3.1 Scalar Chart Mode In the Scalar Chart mode, a user-selectable parameter is plotted over the user-specified frequency range. One adjustable marker can be used to display the frequency and value at the marker position. The marker position can either be user-selected or automatically tracked. See section 2.6. The measurements can be stored at any time on the internal disk by using the save file operation. See section 2.8.
SARK-110-ULM «Marker» 3.2 User’s Manual Marker operations, see 2.6 Smith Chart Mode The Smith Chart mode displays the complex reflection coeffient over the user-specified frequency range. One adjustable marker can be used to display the frequency and value at the marker position. The marker position can either be user-selected or automatically tracked. See section 2.6. The measurements can be stored at any time on the internal disk by using the save file operation. See section 2.8.
SARK-110-ULM User’s Manual «TL Len» Sets the length of a transmission line, see section 4.1 «Marker» Marker operations, see 2.6 3.3 Single Frequency Mode The Single Frequency mode shows various fundamental parameters of a device under test at a single frequency.
SARK-110-ULM User’s Manual stopped after pressing any button. 3.4 SWR Mode The SWR mode displays a VSWR bar chart and the numerical value of this parameter using a big font for better legibility. The Run/Hold [ ] button controls the run status. The measurements can be stopped at any time by pressing the Run/Hold [ ] button and resuming them by pressing this button again. Functions «Center» Sets the frequency, see section 2.3 «Preset» Sets the frequency using a preset, see section 2.
SARK-110-ULM 3.5 User’s Manual Multiband Mode Multiband mode displays the SWR for four different frequencies at a time. This feature can be used to tune multiband antennas. For changing the frequency value, select the band using the left or right arrow buttons and then use the standard procedure for changing the frequency. The Run/Hold [ ] button controls the run status. The measurements can be stopped at any time by pressing the Run/Hold [ ] button and resuming them by pressing this button again.
SARK-110-ULM 3.6 User’s Manual Cable Test Mode (TDR) Cable Test or Time Domain Reflectometer (TDR) mode is intended to identify potential coaxial cable faults that could disrupt signal transmission. Unlike native TDR test equipment, the method of measurement in the SARK-110-ULM is based on the theory of Frequency Domain Reflectometry (FDR).
SARK-110-ULM User’s Manual It is possible to change the number of measurement points. Select «SETUP»«Cable Points TDR» to change the setting. Reducing the number of points speeds up the scan speed but at the expenses of decreasing the resolution of the measurements. Functions «Zoom» Sets the zoom option; see paragraph below. «File» File operations, see 2.8 «Marker» Marker operations, see 2.6 There is a basic zoom feature controllable from the «ZOOM» menu option.
SARK-110-ULM Element User’s Manual Impulse Response Step Response Display Unity reflection Unity reflection Unity reflection, -180º Unity reflection, -180º Positive peak Positive level shift Negative peak Negative level shift Positive then negative peaks Positive peak Negative then positive peaks Negative peak Open Short Resistance R > Z0 Resistance R < Z0 Inductance Capacitance Rev 1.
SARK-110-ULM 3.7 User’s Manual Signal Generator Mode The SARK-110-ULM can be used as a programmable RF signal source in Signal Generator Mode. It outputs a square wave RF signal at a frequency programmable from 0.1 to 700 MHz with two user selectable amplitude levels. In addition, frequency sweeps can be programmed with linear, bi-linear, logarithmic, or bi-logarithmic functions. This mode has a receiver function as well.
SARK-110-ULM User’s Manual Functions «Center» Sets the frequency, see section 2.3 «Preset» Sets the frequency using a preset, see section 2.4 «Modul» Modulation; see paragraphs below. «Level» Low and High Modulation – None Select this function for generating a continuous signal. Modulation – Sweep In frequency sweep mode the signal frequency will sweep between two user-defined frequencies.
SARK-110-ULM User’s Manual Modulation – Rx Mode This function can be used to measure the power of an external signal. Rev 1.
SARK-110-ULM 3.8 User’s Manual Band Scan Mode The SARK-110-ULM can be used as a rudimentary Spectrum Analyzer in Band Scan Mode. It can be used to scan for nearby signals that may interfere with the measurements or to measure the power of the spectrum of signals in a lab environment. Operation is like the Scalar Mode. The sweep speed is slower than in other modes and is largely proportional to the width of the Span setting. Narrower spans yield faster sweeps.
SARK-110-ULM 3.9 User’s Manual Computer Control Mode The SARK-110-ULM can be operated from a computer using SARK Plots software for Windows or Android and other software from third parties, further enhancing the capabilities of the instrument. The command interface specification is open for anyone wishing to develop a client software. The command interface is compatible with the one for the SARK-110. Source code examples of the communication interface are available for different operating systems.
SARK-110-ULM User’s Manual a) Enter Android Setup b) Select «Connections» and then «Bluetooth » c) Select «Scan» d) The analyzer should show up in the list of available devices as SARK110-nnnn (number is unique for each device except by chance) e) Select the device Once the device is paired, launch SARK Plots and ensure that Bluetooth interface is selected. When connected the analyser should show the screen below. Rev 1.
SARK-110-ULM User’s Manual 4 Special Functions 4.1 Transmission Line Add/Subtract The SARK-110-ULM provides the capability of subtracting a length of transmission line (transpose to load) or adding a length of transmission line (transpose to input). Use the subtraction feature to discount the effect of the feed line so the measurements will be as if the analyzer were connected at the antenna feed point. Use the addition feature for simulating the effect of a feed line.
SARK-110-ULM User’s Manual Since the precise cable length is not normally known in advance, there is a procedure to get the cable length as follows. As a precondition the cable must be unterminated at the far end. Select Smith chart mode and set a wide sweep frequency range. The Smith Chart will show a spiral from infinite impedance and going towards the center.
SARK-110-ULM User’s Manual end of the test port extension cable being employed. Please refer to Appendix D: on how to carry out the steps for OSL calibration. The measurement results can be saved in a file in tabular format. The Circuit Models function is only available in the Single Frequency, SWR or Multiband modes. Press the Menu [ ] button, select «Model» and then the desired function in the pop-up submenu. 4.2.
SARK-110-ULM User’s Manual Enter the desired operating frequency Enter the desired scan limit After some seconds the results are shown on the screen.
SARK-110-ULM Rs Equivalent resistance at F = 1 MHz La Equivalent inductance at F = 1 MHz Rp Equivalent resistance at the self-resonant frequency User’s Manual The antenna capacitance is calculated with the following equation: Ca = 1 La (2 Fra) 2 The series equivalent resistance of the antenna at the operating frequency Fop = 13.56 MHz is calculated with the following equation: Ra = Rs + (2 Fop La ) 2 Rp The quality factor is calculated using the following equation: Qa = 4.2.
SARK-110-ULM User’s Manual Select the file name to store the data. Press the Return [ ] button if not needed to save the data. Enter the operating frequency After some seconds the results are shown on the screen. The figure below describes the measured parameters: The internal procedure performed by the analyzer is as follows: the analyzer measures the impedance at 1 MHz and at the desired operating frequency. Then it searches for the selfresonant frequency and measures the impedance at this point.
SARK-110-ULM Ca Equivalent capacitance at F = 1 MHz Ra Equivalent resistance at the self-resonant frequency User’s Manual The capacitor’s parasitic inductance is calculated with the following equation: La = 1 Ca (2 Fra) 2 The quality factor is calculated using the following equation: Qa = 4.2.3 1 (2 Fop Ca Ra) Quartz Crystal This function determines the equivalent circuit model of quartz crystals.
SARK-110-ULM User’s Manual After some seconds the results are shown on the screen. The figure below describes the measured parameters: Series resonant frequency Parallel resonant frequency Quality factor Rs: motional (series) resistance Ls: motional (series) inductance Co: parallel capacitance Cs: motional (series) capacitance Entry number in the file File name The process starts by searching for the series and parallel resonant frequencies.
SARK-110-ULM 4.2.4 User’s Manual Transmission Line This feature allows you to automatically measure different parameters having to do with transmission lines, namely: • The line's characteristic impedance (Z0) • The true velocity factor • The matched line loss in terms of dB over the total line length and in dB/100m The measurement procedure is as follows: Select the file name to store the data. Press the Return [ ] button if not needed to save the data.
SARK-110-ULM User’s Manual Press the Enter [ ] button Connect the transmission line terminated with an open circuit. Press the Enter [ ] button Connect the transmission line terminated with a short circuit. Press the Enter [ ] button After some seconds the results are shown on the screen. Note: Try to keep the electrical length of the line exactly the same between the open and short termination conditions.
SARK-110-ULM User’s Manual Z0 is obtained by calculating the arithmetic mean of the real part of the following equation for all the frequency points: Z 0 = Zoc Zsc The calculation of the Velocity Factor (VF) and matched loss is more convoluted and will not be explained here. The relevant information is that the VF is provided at the upper frequency and the matched loss is provided at the maximum frequency and the arithmetic mean for all frequency points. Rev 1.
SARK-110-ULM Appendix A: Abbreviation User’s Manual Glossary of Parameters Parameter Description Rs Series resistance Resistive value of a series impedance Xs Series reactance Reactance value of a series impedance Rp Parallel resistance Resistive value of a parallel impedance Xp Parallel reactance Reactance value of a parallel impedance |Zs| Magnitude of a Represents the absolute magnitude of the ratio of the series Impedance voltage difference amplitude to the current amplitude.
SARK-110-ULM Abbreviation
SARK-110-ULM Appendix B: User’s Manual Upgrading the firmware The SARK-110-ULM’s firmware may be upgraded via USB as described in the following steps. This procedure assumes you have downloaded the appropriate update file from: http://www.sark110.com/files/sark110ulm/firmware The downloaded file has the following format: SARK110ULM_Vx.y.dfu.zip Where x.y is the incremental version number. The downloaded file must be unzipped to produce an update file in the format: SARK110ULM_Vx.y.
SARK-110-ULM Appendix C: User’s Manual Bluetooth tool firmware The Bluetooth tool firmware, SARK110ULM_BTOOL.dfu, allows the user to perform firmware updates of the internal RN4871 Bluetooth Low Energy module. This is not expected that the user will need to update the module’s firmware, but this function is provided in provision of any required future updates.
SARK-110-ULM User’s Manual Module firmware update The firmware version of the module can be check from the Computer Control mode and with the Bluetooth interface selected. The different versions and release notes are available in the Microchip’s website. In the screenshot below the version is V1.30. To update the module firmware, perform the following steps: 1. Download the firmware update images from Microchip’s website and extract the contents. 2.
SARK-110-ULM User’s Manual a. Select the COM port used by the SARK-110-ULM b. Verify that other settings (baud, memory type, and address) are set as shown below. 6. Click the Connect button and verify the “Port connect -> COMxx” is displayed in the text box. 7. Verify firmware update is successfully completed. The “End of Write Memory” message is displayed. 8. Click the Disconnect button to close the COM port. The “port disconnect” message is displayed at the end of the log window. 9.
SARK-110-ULM User’s Manual Experimenting with the Bluetooth module This tool enables the user to experiment with the RN4871 module. Simple ASCII commands can be set to the RN4871 module by using a terminal emulator program. Complete commands reference is documented in RN4870/71 Bluetooth® Low Energy Module User’s Guide and also RN4870/71 PICtail™/PICtail PLUS DAUGHTER BOARD USER’S GUIDE includes usage guidance. To enable this functionality, perform the following steps: 1.
SARK-110-ULM User’s Manual References Link Description Comments http://www.sark110.com/files/sark1 SARK110ULM_BTOOL.zip – Unzip the file and install it 10ulm/firmware Bluetooth tool firmware following the instructions described in Appendix B: https://www.st.com/en/developmen STM32 Virtual COM Port Driver t-tools/stsw-stm32102.html http://ww1.microchip.com/downloa Install the driver according manufacturer’s instructions.
SARK-110-ULM Appendix D: User’s Manual OSL Calibration The SARK-110-ULM features an OSL calibration method for higher accuracy measurements. Calibration is performed by using a set of calibration plugs consisting of: an Open circuit, a Short circuit and a calibrated Load having the same value as the reference impedance. These loads are connected sequentially to the end of the test lead as instructed on the screen as described below.
SARK-110-ULM User’s Manual After selecting the calibration profile, the profile characteristics are shown in a popup dialog. Once the calibration profile has been selected, press the Setup [ ] button and select «Calibration» «OSL» to start the OSL calibration procedure. The calibration procedure is as follows: Enter the start frequency (default is the lower frequency limit) Enter the stop frequency (default is the upper frequency limit) Rev 1.
SARK-110-ULM User’s Manual Enter an optional name for the profile Display shows the calibration parameters. Press the Enter [ ] button to continue. Connect the open load. Load status is indicated by the status of the |Rh| indicator. If shown in reverse mode denotes incorrect load. Press the Enter [ ] button to continue, or [ ] to exit. The calibration progress will be shown in the display bar. Connect the short-circuit load. Load status is indicated by the status of the |Rh| indicator.
SARK-110-ULM User’s Manual The calibration progress will be shown in the display bar. Connect the reference load. Load status is indicated by the status of the |Rh| indicator. If shown in reverse mode denotes incorrect load. Press the Enter [ ] button to continue, or [ ] to exit. The calibration progress will be shown in the display bar. Press the Enter [ ] button to validate the calibration, or [ ] to exit. Rev 1.
SARK-110-ULM Appendix E: User’s Manual Frequency Calibration This setup permits the frequency synthesizer to be calibrated to generate the exact frequency. The user will adjust the frequency of the synthesizer while measuring it with an accurate frequency counter or, alternatively, zero-beat it against WWV until an exact 10 MHz output is obtained. ➢ For best accuracy, turn on the unit for at least 10 or 15 minutes before calibrating.
SARK-110-ULM Appendix F: User’s Manual Detector Calibration This procedure performs alignment of the SARK-110-ULM’s internal measurement circuits. This operation is done once at the factory and it is not necessary for the user to repeat it, but the procedure is detailed for completeness. For Detector calibration it is required a 50-ohm load. Before performing this operation, it is strongly recommended that the file containing the factory results, detcalib.
SARK-110-ULM Appendix G: User’s Manual Frequency Presets File Default frequency presets can be modified by the user by supplying a special text file stored on the analyzer’s disk. The file name must be “presets.
SARK-110-ULM Appendix H: User’s Manual Scale Presets The following tables show the default scale presets: Normal Rs Xs Rp Xp |Zs|
SARK-110-ULM User’s Manual Default scale presets can be modified by the user by supplying special text files stored on the analyzer’s disk. The file names for each of the scales have to be the following: • «Scale» «Normal» → “scal_def.txt” • «Scale» «High» → “scal_hig.txt” • «Scale» «Low» → “scal_low.txt” • «Scale» «Auto» → “scal_aut.txt” The files must contain an entry for each parameter with the following syntax: min,max,log {Y,N} Note that logarithmic scales do not accept negative ranges.
SARK-110-ULM Appendix I: User’s Manual Custom Cable Settings The SARK-110-ULM allows the user to specify three custom cable settings by supplying a special text file stored on the analyzer’s disk. The file name must be “custcab.
SARK-110-ULM Appendix J: User’s Manual Specifications Feature SARK-110-ULM LCD Frequency range 2” Monochrome 128 x 64 pixels 0.
SARK-110-ULM Impedance reading in open User’s Manual 120K (@1 MHz) circuit Distance resolution in TDR 5 cm (2 inches) mode Internal data memory 2 MB for storage of measurements, configuration and firmware upgrades OSL Calibration 8 Calibration profiles 400 points USB • Micro-USB connector • Mass Storage class • HID class Wireless interface Short-range Bluetooth Low Energy Battery Li-Poly 1000 mAh Internal battery charger 8-hour autonomy; 3.5-hour charge Charge via USB Modes Rev 1.
SARK-110-ULM Special functions Dimensions Package contents Rev 1.
SARK-110-ULM Appendix K: User’s Manual Acknowledgments The SARK-110-ULM has been developed in partnership with the Seeed Studio team, which has been essential to make this product a reality. Seeed manufactures, promotes and distribute the product worldwide. Many of the SARK-110 product series features are a reality thanks to the great community behind, always suggesting features and providing useful feedback.