
Product Info
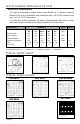

SPLATCH SERIES PERFORMANCE DATA
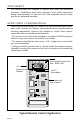
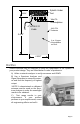
About These Measurements
The typical performance graphs below were based on a "Splatch" antenna
affixed to the test jig illustrated, and measured with a HP-8753D network ana-
lyzer in a 20°-25°C environment.
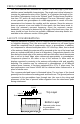
*As of the time of this publication, full pattern characterization data was not avail-
able. Refer to the Linx website for periodic updates to this document.
TYPICAL SMITH CHART
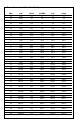
TYPICAL VSWR GRAPHS
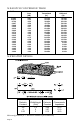
Specification Frequency Units Notes
315 418 433.92 868 900 MHz
Electrical Length 1/4
λ 1/4λ 1/4λ 1/4λ 1/4λ
Center Frequency 315 418 433.92 868 916 MHz 1
Useable Bandwidth 10 10 10 20 40 MHz
Characteristic Impedence 50Ω 50Ω 50Ω 50Ω 50Ω Ohms 1, 2
VSWR <1.7 Typ. <1.7 Typ. <1.7 Typ. <1.7 Typ. <1.7 Typ. 1
Gain/<Loss> -10 -6 -5 -2 -1 1, 3, 4
Notes:
1. At Specified Frequency; 2. VSWR <2.0; 3. Relative to isotropic; 4. Preliminary
1
-5.3926 Ω 70.607 pF
CH1 S
11
1: 51.189 Ω
START FREQ. 250.000 MHz
STOP FREQ. 500 MHz
Marker 1 = 315 MHz
CH1 S
11
SWR 1 / REF 1
Start Frequency 800.000 MHz
Stop Frequency 1100.000 MHz
hp
MARKER 1
MARKER 2 MARKER 3
Marker 1 = 902 MHz 1.868 VSWR
Marker 2 = 916 MHz 1.435 VSWR
Marker 2 = 928 MHz 1.58 VSWR
315 MHz
868 MHz
418 MHz 433.92 MHz
900 MHz
Page 4