Smart Systems User’s Manual Version 1.1 the user will find a data image (CART-n.PCX) file on the external computer in the current directory. When the data transfer is complete, on the external computer, exit from the WinPXFER program. Press any button on the DVL to return to the Noggin screen. 5.3.3 View Menu The View function allows the user to scroll back through previously recorded data in the same manner as the Print function (see Section 5.3.2). 5.3.4 Calib.
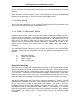
Smart Systems User’s Manual Version 1.1 Pressing the up, down left, right, wider and narrow buttons once makes a very small change in the position or width of the hyperbola. These buttons must sometimes be pressed many times to move the hyperbola to the correct position or width. To speed up the movement of the hyperbola, use the REPEAT button. For example, to move the hyperbola up a long distance, press the up button (5) followed by the REPEAT button.
Smart Systems User’s Manual Version 1.1 Hyperbola Matching calibration can only be done during data acquisition. It cannot be done when viewing previously collected data. Further, the Hyperbola Matching calibration is only available after at least half a screen of data with the same depth setting have been collected. If less than half a screen of data are collected and the CALIB button is selected, only calibrations selecting a material or inputting a velocity are available (see below).
Smart Systems User’s Manual Version 1.1 If units are metres then depths will appear in metres. If units are feet then depths will appear in feet. Velocities appear in both metres per nanosecond (m/ns) and feet per nanosecond (ft/ns). To change units see Section 5.5.1 - Units. Selecting a Media If a good hyperbola or a target of known depth is not available, the user will have to estimate the velocity by selecting the predominant material in the area.
Smart Systems User’s Manual Version 1.1 5.3.5 Depth Menu This button cycles through 5 different depth ranges. The velocity of the material determined under Calibration (Section 5.3.4) affects the total apparent depth scanned. See Section 5.8.1 for more details about how depth is calculated. The Depth units can be changed to metres, feet or time in nanoseconds. For details, see Section 5.5.1 – Units.
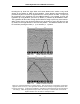
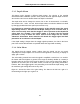
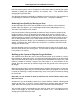
Smart Systems User’s Manual Version 1.1 Figure 5-7: Effects of the Gain setting If the user finds that they are always using very high or very low gain settings to see the data adequately, the user may want to adjust the Linear Gain setting under Setup (see Section 5.5.1 – Linear Gain). 5.3.7 Start Menu The Start button will begin the acquisition of data and displaying of data to the screen.
Smart Systems User’s Manual Version 1.1 appeared on the left. The current battery voltage will then be displayed on the left side of the screen. This battery voltage appears only briefly before starting data collection. Anytime the Start button (or Smart Handle button) is pressed, the current date and time are written vertically on the screen to indicate the start of a new section (see Section 5.5.1 – Time and Date to set time and date). The position indicator is also reset to zero.
Smart Systems User’s Manual Version 1.1 5.4 Noggin Data Acquisition Data acquisition is done simply by pushing the Smart Cart or Smart Handle system along the survey line. This is usually done with the odometer active, however, it is possible to turn off the odometer and run the Smart System in continuous operation (see Section 5.5.1 – Odometer Active). During data acquisition, the settings for Depth (Section 5.3.5) and Gain (Section 5.3.
Smart Systems User’s Manual Version 1.1 Note that Smart systems can be configured to collect data either by pushing the system (forward) or pulling the system (reverse). See Section 5.5.1 – Cart Direction about changing the system direction. The odometer should be periodically re-calibrated to ensure accuracy. The procedure for re-calibrating the odometer is described in Section 5.5.1 – Odometer Calibration.
Smart Systems User’s Manual Version 1.1 5.4.2 Collecting Data using Continuous Operation (No Odometer) It is also possible to turn off the odometer input and have the Noggin system run in continuous mode (see Section 5.5.1 – Odometer Active). This means that the system collects data even if it is not moving. This option may be the only way of collecting data when using an odometer wheel is not practical.
Smart Systems User’s Manual Version 1.1 The user is prompted to delete data when the maximum number of screens (250) has been reached. When this occurs, the user MUST delete 10%, 25%, 50%, 75% or 100% of the screens. Note that when less than 100% of the screens are being deleted, the oldest screens are deleted first. It is also possible to delete all or some of the current screens of data before 250 have been collected.
Smart Systems User’s Manual Version 1.1 5.5 Noggin Setup 5.5.1 Editing DVL Settings Pressing the number 1 on the main menu selects the SETUP item. SETUP lists the settings that can be edited in the Noggin software. Pressing the 1 button (labelled NEXT) moves forward through the list and pressing the 2 button (labelled PREV) moves backward through the list. To select a setting to edit, press the 3 button (labelled SET).
Smart Systems User’s Manual Version 1.1 displayed in time (nanoseconds). If time is selected the “depth” lines (Section 5.2.2) are actually time lines. Odometer Markers This setting determines whether a vertical dashed line is put on the data image each time a position label is written to the screen. The available options are: 1) Place a fid at each label 2) No fids at position labels (default) Odometer Calibration The odometer should be calibrated periodically to ensure accuracy.
Smart Systems User’s Manual Version 1.1 Odometer calibration values for the Smart Cart odometer should be around 4000. Odometer calibration values for the Smart Handle odometer should be around 1500. Odometer calibration values for the Vehicle odometer vary but may be around 50. Cart Direction This setting determines whether data are collected as the Smart System is pushed forward or pulled in reverse. The back up arrow (see Section 5.4.1) will work in the direction opposite to this setting.
Smart Systems User’s Manual Version 1.1 Station Interval As the Smart Cart moves, the odometer triggers the system to collect a data trace at fixed distance intervals. This interval is called the “station interval”. The station interval can be changed to allow a longer or shorter distance between traces. For a successful survey, it is important that several traces be collected over a target.
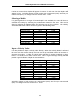
Smart Systems User’s Manual Version 1.1 Note that decreasing the station interval increases the data volume and increasing the station interval reduces the data volume. The choices available are: 1) 2) 3) 4) 5) 6) 7) 8) 9) Short Normal Long X-Long Normal x 10 Normal x 20 Normal x 40 Normal x 50 Normal x 100 Each choice listed will be followed by an actual value in metres or inches depending on which units are selected and which Noggin system is being used.
Smart Systems User’s Manual Version 1.1 Noggin 1000 System Setting Short Normal Long X-Long Norm x10 Norm x20 Norm x40 Norm x50 Norm x100 Station Interval Data per Screen 0.5 cm or 0.24 in 1.0 cm or 0.48 in 2.0 cm or 0.96 in 5.0 cm or 2.4 in 10 cm or 4.8 in 20 cm or 9.6 in 40 cm or 19.2 in 50 cm or 24.0 in 100 cm or 48.0 in 3.2 m or 12.8 ft 6.4 m or 25.6 ft 12.8 m or 51.2 ft 32.0 m or 128 ft 64.
Smart Systems User’s Manual Version 1.1 Arrow Reference Section 5.4.1 describes the Back-up Arrow that appears when a Smart System is backed up. The Back-up Arrow allows the user to pinpoint the exact ground position corresponding to a target response on the data image. The Arrow Reference value is used to change the physical position that corresponds to the Back-up Arrow. If the Arrow Reference value is set to the default value of zero (0.
Smart Systems User’s Manual Version 1.1 GPS Setup Menu The Global Positioning System (GPS) uses special satellites around the Earth to determine the position of a GPS receiver located at any position on the surface of the Earth. GPS receivers can be purchased from a number of manufacturers. The DVL has a serial port on the back for attaching a GPS receiver. This port will accommodate any GPS receiver that has a standard serial port output.
Smart Systems User’s Manual Version 1.1 Mode There are three GPS modes available: 1) Off mode means that a GPS receiver is not connected to the DVL so no GPS information is being logged. This should be the setting if you do not have a GPS receiver. 2) Display every X traces mode means that every time the Noggin collects a userdefined number of traces trace of GPR data, a data string of GPS information will be written to the data image.
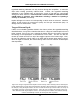
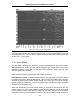
Smart Systems User’s Manual Version 1.1 3) Tagging with the A Button mode means that whenever the A button is pressed during data acquisition, a data string of GPS information will be written onto the data image. For example, the data may look like this: Figure 5-10: Noggin Data with GPS information written to the screen when the A button is pressed. Baud Rate The baud rate is the speed that data is sent from the GPS receiver to the serial port of the DVL.
Smart Systems User’s Manual Version 1.1 End String The GPS receiver can be set up to send one or more types of data strings. These strings are called NMEA-0183 strings and each contains positional or other information in specific formats. Each type of string is specified by a 5-character prefix. There are numerous NMEA strings but examples of three different NMEA strings (GPGGA, GPVTG and GPGSA) are shown below. $GPGGA,134713.00,4338.221086,N,07938.421365,W,2,06,2.1,152.51,M,-35.09,M,5.0,0118*79 $GPVTG,34.
Smart Systems User’s Manual Version 1.1 System Test #2 Once the GPS system is running successfully, System Test #2 can be used to graphically display the GPS data. This screen displays the GPS Time, Latitude, Longitude and Altitude as well as other values indicating the accuracy of the GPS reading. The GPS position is also displayed in a square that can be Zoomed from 2 metres square to 16384 metres square.
Smart Systems User’s Manual Version 1.1 5.6 Noggin Buffer File Management Files collected with the Noggin system can be transferred to an external computer (Section 5.6.1) or deleted from the DVL (Section 5.6.2). 5.6.1 Transferring all Buffer Files to an External Computer using the WinPXFER Program Pressing the number 2 on the main Noggin menu transfers ALL the data buffers (up to 250 screens) from the DVL to an external computer.
Smart Systems User’s Manual Version 1.1 WARNING: To avoid damaging any of the components, turn off the DVL and computer before making any of these connections. Installing and Running the WinPXFER Program The Smart system comes with a CD-ROM containing the WinPXFER program. To install the WinPXFER program, follow the directions in the “Getting Started” document that accompanies the CD. Basically, running the SETUP.EXE program from the WinPXFER folder on the CD will install WinPXFER on the computer.
Smart Systems User’s Manual Version 1.1 Transferring Buffer Files Once the parallel XFER cable is connected (Section 5.6.1) and the WinPXFER software is installed and running (Section 5.6.1), it is now possible to transfer all data buffer files to the external computer. On the DVL, from the main menu, select number 2 – TRANSFER ALL BUFFERS. The data will be transferred from the DVL to the computer and saved in the current working directory.
Smart Systems User’s Manual Version 1.1 Viewing SPI Files in SpiView on the External PC If the buffer data transferred to the external computer are to be viewed using the SpiView software, all of the data buffer files (SPIxx.PCX) must be copied to the \SPIVIEW\BUFFERS directory. Any buffer data files in this directory should be moved or deleted before the new buffer data files are copied. Alternatively, the buffer location can be changed using the SPI_LOAD.INI file (see the SpiView Manual for details).
Smart Systems User’s Manual Version 1.1 5.8 Advanced Topics 5.8.1 How Depth is Determined Ground penetrating radar systems record the time for a radio wave to travel to a target and back. The depth to that target is calculated based on the velocity at which the wave travels to the target and back. It is calculated as: D = V x T/2 Where D is Depth (m) V is Velocity (m/ns) T is Two-way travel time (ns) The wave velocity depends on the properties of the material.
Smart Systems User’s Manual Version 1.1 6 Nogginplus 6.1 Overview of Nogginplus Menu Options The Nogginplus main menu has the following choices: A – LINE B – GRID 1 – NOGGIN PLUS SETUP 2 – FILE MANAGEMENT 3 – RUN WITHOUT SAVING DATA 4 – UTILITIES 7 – RETURN 12.1 V Rev 3.00 6.1.1 Line Survey lines collected with the Nogginplus are saved as digital data files that can be viewed on the DVL or exported to an external computer for processing and plotting.
Smart Systems User’s Manual Version 1.1 Before the data acquisition on a grid begins, the user must define the size of the area to be surveyed, the direction of the survey lines and line spacing. The details of the grid survey are specified in the Grid Setup menu option (see Section 6.3.4). 6.1.3 Setup There are many background setup parameters related to the Noggin Smart Systems operation for line and grid surveys that can be edited.
Smart Systems User’s Manual Version 1.1 6.2 Nogginplus Data Acquisition Selecting the Line, Grid or Run without Saving Data options from the main Nogginplus menu will start data acquisition. The Run without Saving Option goes straight to data acquisition while the Line and Grid options require the user to select a project number, file number and press Run before data acquisition begins. If the Auto Start option is set to ON (see Section 6.3.
Smart Systems User’s Manual Version 1.1 6.2.1 Replaying or Overwriting Data Immediately after a data file has been collected and the Stop button (or Smart Handle button) pressed, the data file can be replayed by pressing the left and right arrow buttons to the scroll the data to the left and right. As well, during data replay, the data can be enlarged or “zoomed” by pressing the Zoom button and changing the zoom factor. For example, zooming 2 times on data with a depth setting of 5.
Smart Systems User’s Manual Version 1.1 6.2.3 Section A – Position Information The very top section (Section A) contains horizontal spatial positioning information in feet or metres depending on the position units setting (see Section 6.3.1). 6.2.4 Section B - Data Display This section contains the actual data collected or replayed. The section also contains the depth indicator lines and any fiducial markers the user enters. See the sections below for more details.
Smart Systems User’s Manual Version 1.1 If a GPS receiver is attached to the DVL, a file containing GPS information can be saved. In Fuducial Tagging mode, whenever a fiducial marker is added to the data, a line of GPS information will be added to the GPS file (see Section 6.3.5) 6.2.5 Section C - Menu The bottom section (Section C) contains the user menu selection and current program settings.
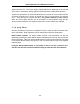
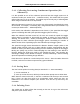
Smart Systems User’s Manual Version 1.1 Figure 6-2: Effects of the Gain setting Note that the gain setting is only for data display. The data are always saved without any gain applied. It is not possible to collect Nogginplus data with an “incorrect” gain setting. If the user finds that they are always using very high or very low gain settings to see the data adequately, the user may want to adjust the Linear Gain setting under Setup (see Section 6.3.1). 6.2.
Smart Systems User’s Manual Version 1.1 displays 6.4 metres (25.6 feet) of data for the Noggin 1000. The odometer units that appear across the top of the screen can be set to either metres or feet (see Section 6.3.1). During data acquisition, the current odometer position value (in the current units, either metres or feet) is written to the lower left corner of the screen (see Figure 6-1). Note that Smart Systems can be configured to collect data either by pushing or pulling the Noggin. See Section 6.3.
Smart Systems User’s Manual Version 1.1 This feature is useful for producing a continuous data image even if the system is backed up during the survey line. Note that it is not possible to back up and have the arrow indicator move more than one screen. The physical position corresponding to the Back-up arrow is the centre of the Noggin. This position can be changed from the centre of the Noggin to any other position. See Section 6.3.2 on changing the Arrow Offset value. 6.2.8 Calib.
Smart Systems User’s Manual Version 1.1 change in the position or width of the hyperbola. These buttons must sometimes be pressed many times to move the hyperbola to the correct position or width. To speed up the movement of the hyperbola, use the REPEAT button. For example, to move the hyperbola up a long distance, press the up button (5) followed by the REPEAT button. The hyperbola will then start moving upward without having to press any more buttons.
Smart Systems User’s Manual Version 1.1 In Nogginplus mode, hyperbola Matching calibration can be done during data acquisition and also while viewing previously collected data. If units are metres then depths will appear in metres and velocities in metres per nanosecond (m/ns). If units are feet then depths will appear in feet and velocities in feet per nanosecond (ft/ns). To change units see Section 6.3.1 – Depth Units.
Smart Systems User’s Manual Version 1.1 If units are metres then depths will appear in metres and velocities in metres per nanosecond (m/ns). If units are feet then depths will appear in feet and velocities in feet per nanosecond (ft/ns). To change units see Section 6.3.1 – Depth Units. 6.2.9 Error Messages If an error occurs during data acquisition, an error message will appear in the bottom left section of the data acquisition screen.