
Users Manual Part 2

9 Using the QC Program
Operator’s Manual 9 - 7
9.2.3 Reviewing QC Results
After QC analysis, you can review the QC results in the “QC Table” review or “QC Graph”
review.
QC graph review
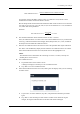
Reviewing QC Graph:
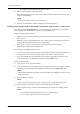
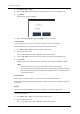
1. Tap “Menu > QC > Setup” to enter the QC file setup screen.
2. Select the desired QC file to review.
The “*” mark displays next to the “File No.” of the selected QC file.
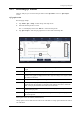
3. Tap “QC Graph” to enter the QC graph review screen of the selected QC file.
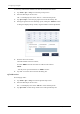
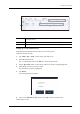
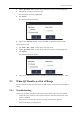
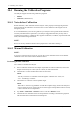
Entering the Causes of Outliers (Administrators)
The QC point is out of value when its value is out of the limit. A red QC point indicates the value is
out of the limit.
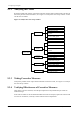
1. The Mean, SD and CV% of all the QC results of each parameter in the current
graph.
2. The saving date and time of the QC point on the green line.
3. The line connecting all QC points of the same parameter to show the trend. The QC
points in each graph are displayed from left to right according to the sequence from
the earliest to the latest.
4. The QC result of the QC point on the green line.
5. Currently selected QC point. The analysis result of the selected QC point is
displayed under the parameter. A black QC point indicates the value is within the
limit; a red QC point indicates the value is out of the limit.
6. The green vertical line is used to identify a selected QC point and all parameter
values of the QC point.
7. The sequence number of the QC point on the green line among all the QC points in
the current QC file.
1
2
7
3
4
5
6