
Getting Started Guide
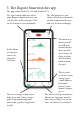
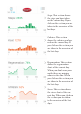
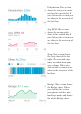
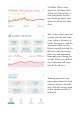
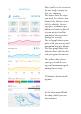
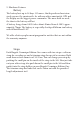
Table Of Contents

Here you‘ll see the overview
for one single activity, in
this case running.
e boxes show the steps
you took, the calories you
burned, the distance trave-
led, the altitude, the ave-
rage pace in minutes per
kilometer (can be adjusted
to your metric) and the
amount of water you lost
during the activity.
e red graph shows your
pulse with you average and
maximum beat per minute.
e blue graph shows the
altitude chart with the alti-
tude you gained in meters.
e yellow chart shows
your speed with the ave-
rage and maximum speed
during this activity.
VO2max is shown in ml/
kg/min
At the bottom you‘ll nd
the map, which you can
also zoom in.