
System information

From the Spectrum Manager menu: Manual > Scan
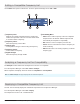
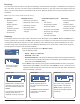
1. Set the following modes:
• Sweep = Single or Continuous
• Peak Hold = Off or ON
• Exclusion Threshold = The Spectrum Manager excludes scanned frequencies above
this value from the Compatible Frequency List calculation. The threshold can be viewed
during edit on the Scan Data display.
2. Press Start to begin scanning. Scan progress is displayed while the scan is in-progress.
When finished, press Store to save the scan. Select Recall to access a stored scan. The
recalled scan will overwrite the current scan data. Unsaved scan data will be cleared if the
Spectrum Manager is turned off.
Cursor
Zoom
Peak
Listen
-20
-40
-60
-80
-100
dBm
470.000 Mhz 952.000 Mhz
Cursor
Zoom
Peak
Listen
-20
-40
-60
-80
-100
dBm
470.000 Mhz 952.000 Mhz
Cursor
Zoom
Peak
Listen
-20
-40
-60
-80
-100
dBm
470.000 Mhz 952.000 Mhz
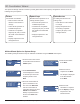
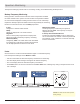
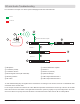
Cursor adds a movable vertical
dashed line on the RF plot. Use
the control wheel to position the
Cursor.
The frequency value and signal
strength at the cursor are
displayed on the top of the plot.
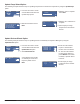
Zoom magnifies RF plot at
the cursor to allow for detailed
analysis.
Use Zoom to identify individual
frequencies in crowded RF
environments.
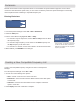
The cursor to only selects the
highest peaks of the RF plot.
Peak provides a quick way to
identify the strongest signals in
the RF plot.
Cursor Tool Zoom Tool Peak Tool
Sweep: Single
Peak Hold: Off
Exclusion
Threshold
Start
Recall
Store
-85 dB
-20
-40
-60
-80
-100
dBm
470.000 Mhz 952.000 Mhz
The RF plot is shown
on the Data Display
screen.
Event Log
The event log records the actions of the Spectrum Manager and other devices it manages, as listed below. The log stores
up to 150 events. The start of an event record is indicated with an asterisk (*). The most recent events appear at the top of
the log. Use the control wheel to scroll through the list of events. When the storage limit is reached, the oldest events are
overwritten.
Note: A power cycle or firmware update will clear the event log.
Frequencies:
• Backup frequency
degraded
• Backup frequency
upgraded
• Frequency served to
[channel name]
• Scan Stored
Managed Devices:
• [Device ID] goes off-line
• [Device ID] comes on-line
• [Device ID] removed
• [Device ID] added
• Transmitter [Tx] profile
changed
Compatible Frequency List
(CFL):
• CFL cleared
• New frequency added
• Frequency deleted
• Frequency value changed
• Frequency type changed
• CFL deployed
• New CFL calculated
Exclusions:
• Exclusion threshold
changed
• Exclusion added
(frequency or range)
• Exclusion cleared
(frequency or range)
Scanning
Performing a spectrum scan creates a plot of RF activity on the data display. Use the Cursor, Zoom, and Peak tools to
examine a specific area of the plot. The Store option allows for one complete set of scan data to be saved to the memory
of the Spectrum Manager for reference or for CFL calculation. Scans initiated from the Spectrum Manager menu cover
the entire tuning range. The Frequency Plot tool in Wireless Workbench can be used to scan a subset of this range and
provides options for step size and resolution bandwidth.
106
Part 3: System Operation