
System information

76
Part 2: System Setup and Configuration
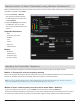
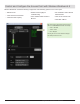
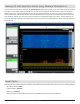
Viewing 2.4 GHz Spectrum Activity using Wireless Workbench 6
The 2.4 GHz plot accessed by clicking on the ShowLink Plot toolbar option, allows you to see activity across all ShowLink
channels. The plot shows activity by other devices on each of the 16 channels and the location of other access points
within the spectrum. The ShowLink plot contains a live 2.4GHz measurement, as well as a 10-second moving average
and maximum value over the scan duration. Run the ShowLink plot from any Access Point without any effect on the real-
time ShowLink network. Save the scans to files for future use or playback the data at any point in the time history of the
record. By selecting an Access Point to perform the scan, you can see the 2.4 GHz spectrum density seen at that Access
Point over time.
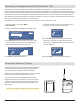
Reset Option
Pressing the reset button located on the bottom of the AXT610 housing restores the access point to the following settings:
• IP Address Mode = DHCP
• Channel Agility = Enabled
• Device ID = [AXT610]
• DeviceAssociationTableswillbeclearedandre‐establishedwiththereceiversautomatically