
User Manual

59/72
Siemens PXM20 / PXM20-E operator unit CM110754en_06
Building Technologies 12BTrend function and settings 2017-04-05
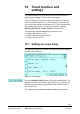
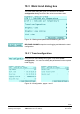
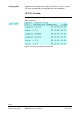
10.3.3 Graphic view online
The Graphic view online displays the required value dynamically,
i.e. in real time.
Note
To view all the values so far stored in the PXM20, select Graphic
view (Section 10.3.2).
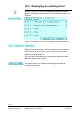
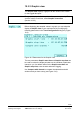
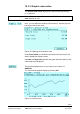
Here, you can define the duration ("Record time"), and the high and
low range limits for the value.
Figure 10-8 Settings in the Graphic view.
Under Record time you can define the period of time for which you
want to display this dynamic trend.
Low limit and High limit represent the upper and lower limits for the
value range to be displayed.
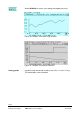
The trend is displayed soon as you confirm your entries via
GRAPHIC.
You can reset the graphic display by pressing OK.
Figure 10-9 Online trend