
User Manual


Building Operator User Guide
Operation and Monitoring
1
10 | 22
A6V11881696_en_h
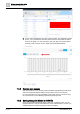
5. A new window will appear to the right of the list results. The default time period
is Hour. You can select the other time-value buttons to manipulate the period
shown in the graph. You can also select, hold, and drag on the graph itself to
manually create a custom, more in-depth view (as illustrated below).
1.3.2 Remote web access
This Service allows you to remotely expose available web applications that reside
within the remote building automation control network at the connected site.
For more information on how to establish a remote web access connection using
the Connect X300, see the Building Operator Engineering Guide.
1.3.3 Saving data point history to CSV file
Once you have selected the time range of data you would like to view, you can
export the data to a CSV file. This allows the use of collected data in a user's own
analytics pipeline to analyze energy flows and consumption.