Building Operator User Guide A6V11881696_en_j 2021-03-12 Smart Infrastructure
Edition notice Edition notice Technical specifications and availability subject to change without notice. This document may not be reproduced, disseminated to third parties or processed and its contents may not be used or disclosed without express permission. Noncompliance shall result in compensation for damages. All rights, including those resulting from a successful patent application and registration of a utility model or design patent, are reserved.
Cybersecurity disclaimer Cybersecurity disclaimer Siemens provides a portfolio of products, solutions, systems and services that includes security functions that support the secure operation of plants, systems, machines and networks. In the field of Building Technologies, this includes building automation and control, fire safety, security management as well as physical security systems.
Copyright Notice Copyright Notice Data and design subject to change without notice. / Supply subject to availability. © Siemens Switzerland Ltd (2020) Desigo and Cerberus are trademarks of Siemens Schweiz AG. Other product or company names mentioned herein may be the trademarks of their respective owners. We reserve all rights in this document and in the subject thereof.
Table of Contents 1 Building Operator User Guide ..................................................................... 7 1.1 Before you start ............................................................................................... 7 1.2 Getting Started Through MindSphere ............................................................. 8 1.3 Getting started ................................................................................................. 8 1.4 1.5 1.3.1 Signing up .............
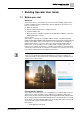
Building Operator User Guide 1 Before you start 1 Building Operator User Guide 1.1 Before you start Overview This Service allows you to remotely operate and monitor building equipment like heating, ventilation and air conditioning as well as applications and meters for a fleet of connected sites.
1 Building Operator User Guide Getting Started Through MindSphere – Functional Connect X300 Gateway – Chrome or Firefox browser – Screen resolution 1920 × 1080 or higher – Internet connection on premise Learn more about Building Operator:https://new.siemens.com/global/en/products/buildings/digitalization/buildi ng-operator.html. Data Privacy in Building Operator The personal data in relation with Building Operator will be deleted on request in any event.
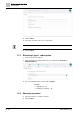
1 Building Operator User Guide Getting started 5. Check your inbox for an email from Siemens ID. Click on Verify my email. 6. Go back to the initial tab and select Continue. 1.3.2 Creating a company You have registered as a Siemens ID User. Signing up [➙ 8] You have received an email with your license and subscription. 1. Click Log In / Sign Up > Subscribe now 2. Select the Country. 3. Fill out the Company and Address fields.
1 Building Operator User Guide Getting started 4. Click Continue. 5. Select the checkbox to the access agreement. Terms and conditions are specific to your country. 6. Click Continue. 1.3.3 Activating a type 1 subscription You have created a company. 1. Copy and paste the entitlement ID from your email into the Activation / Entitlement ID field. 2. Once the entitlement ID is verified, click Continue. See also Signing up [➙ 8] Creating a company [➙ 9] 1.3.4 Choosing a product 1.
1 Building Operator User Guide Getting started 3. Review the details of your subscription. 4. To confirm your selection and activate the subscription, click Activate. A success message will open. 5. Continue the adding process by selecting one of the following options: ● ● ● ● 1.3.5 Invite: Invite users to the company you had just created. Inviting users. Add: Create and add a new site to your company. Asset Manager User Guide (A6V12060067) Overview: Continue to the Overview page of Account Manager.
1 Building Operator User Guide Operation and Monitoring 1.4 Operation and Monitoring 1.4.1 Viewing sites and building data 1. Find and select the site you wish to view in the Site list view. 2. Select the equipment you want operate. Building Operator uses Haystack tags, generated in Building Operator Discovery to identify, organize and map specific data. For more information regarding Haystack, please see: https://project-haystack.org/tag.
1 Building Operator User Guide Operation and Monitoring For more information on how to establish a remote web access connection using the Connect X300, see the Building Operator Engineering Guide. 1.4.3 Selecting Data Point Settings The Display Settings select whether you see the BACnet object name or BACnet object description as the primary identifier for the device’s data points. In Building Operator: 1. Select a site where you want to change data point view. 2. Go to Settings. 3.
1 Building Operator User Guide Operation and Monitoring 1. Select the data point with the information that you want to save. 2. In the upper right corner of the chart, click . The CSV file will automatically download to your browser’s download location. 1.4.5 Printing data point history Printing data point history is available for multi-point trend analysis configurations.
Building Operator User Guide 1 Operation and Monitoring 1. Select the data point with the information that you want to save. 2. To download the PDF, click . The PDF file gets download at your browser’s download location and can be printed. 1.4.6 Using the bar chart option To view energy consumption values in the bar chart option: In Building Operator: 1. Select the site you want to view. 2. Go to Equipment. 3. Select the equipment you want to view.
1 Building Operator User Guide Multi-point trend analysis 4. In the search bar, select Tags. 5. Select meter. 6. Select a data point. 7. Use the icons at the top of the chart to toggle between the line and bar chart options. You can switch between different aggregation levels using the drop down menu. 1.5 Multi-point trend analysis The multi-point trend analysis feature allows you bring up to 10 points into one chart.
Building Operator User Guide 1 Multi-point trend analysis 1.5.1 Creating a trend 1. Select a site to create a trend. 2. Go to Trend analysis > Add. 3. Click Options > Edit. 4. In the Options tab, type the name of graph in the Title field and edit the Default time period to the desired choice.
1 Building Operator User Guide Multi-point trend analysis ◈ Click > Save. A trend is created. 1.5.2 Editing a trend Other features, such as styling and visual edits, are also available for multi-point analysis trends. Adding data points You have created a trend analysis in the Operator. Trend Analysis tab of Building 1. Select a trend to add the data points 2. Click 18 | 25 > Edit.
Building Operator User Guide 1 Multi-point trend analysis 3. In the Series tab, click Add data points. 4. Select a point in the Available list, click to add it to the list of selected points and click Confirm. You can select up to 10 data points.
1 Building Operator User Guide Multi-point trend analysis 5. Select a point in the Selected list, click to remove it from the list of selected points and click Confirm. Removing data points If removing a point in Building Operator Discovery that is also in a trend analysis chart, you must go to the data point list in the trend analysis and re-confirm the points you want in the chart. You have added data points in a trend analysis in Building Operator, in the Trend Analysis tab: 1.
Building Operator User Guide 1 Multi-point trend analysis Editing the trend name 1. In the Options tab, Title field, change the name of the Trend . 2. To save your changes, click > Save. Editing data points settings 1. Go to Series > Style, click – – A6V11881696_en_j to open the Style menu. Select the color of your choice from the Color panel for each data point to represent Select the width of your choice for each graph line.
1 Building Operator User Guide Multi-point trend analysis – – – Select the line style of your choice for each graph line. Select the Marker of your choice for each data point over the graph lie. If you want to smoothen the graph line, turn on Smoothing. 2. Click outside the pop-up to exit the color menu. 3. Click 1.5.3 and Save. Deleting a trend 1. Select the trend that you want to delete. 2. Click > Confirm. A message will appear when the trend analysis is successfully deleted.
Building Operator User Guide 1 User permissions 1.6 User permissions App Monitor Account Manager ● ● ● ● ● ● Asset Manager A6V11881696_en_j ● ● Operator Engineer Administrator View users Monitor role permissions View and... company overview View my account View subscriptio ns View invitations Manage my profile: – Edit profile – Leave membe rship – Reque st deletio n Operator role permissions and... Engineer role permissions and...
1 Building Operator User Guide User permissions App Monitor Operator Engineer Administrator device Applicable: web – Intellig interfac ent e Valve – Conne – Conne cted ct devices device ● Remote Tool Access Applicable: – ABT Site Building Operator ● Monitor role Permissions permissions for Operator and...
Issued by Siemens Switzerland Ltd Smart Infrastructure Global Headquarters Theilerstrasse 1a CH-6300 Zug +41 58 724 2424 www.siemens.com/buildingtechnologies © Siemens Switzerland Ltd, 2019-2020 Technical specifications and availability subject to change without notice.