
User Manual

Building Operator User Guide
Multi-point trend analysis
1
16 | 25
A6V11881696_en_j
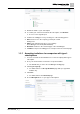
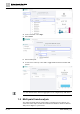
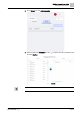
4. In the search bar, select Tags.
5. Select meter.
6. Select a data point.
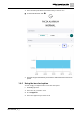
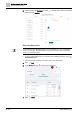
7. Use the icons at the top of the chart to toggle between the line and bar chart
options.
You can switch between different aggregation levels using the drop down menu.
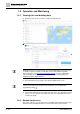
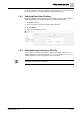
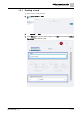
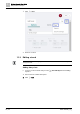
1.5 Multi-point trend analysis
The multi-point trend analysis feature allows you bring up to 10 points into one
chart. This feature helps visualize and understand correlations between different
data point to diagnose system issues.