
User Manual


5
Smart Infrastructure
CE2N5372en
2021-04-
06
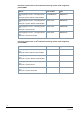
Pressure loss characteristic WS.6..
Nominal flow
q
p
m
3
/h
Mounting
length
mm
Connecting
thread
G/DN
Pressure
loss at q
p
mbar
Kv value at
Δp = 1 bar
m
3
/h
Curve in the
diagram
0.6 110, 190 G ¾ 150 1.5 A
1.5 130, 190 G 1 160 3.8 B
1.5 110 G ¾, 150 3.9 C
2.5 190 G 1 210 5.3 D
2.5 130 G 1 200 5.6 E
Display
The WS.. has a large, easy-to-read LCD with 7 digits to display different values (e.g. energy
or flow). This new type of dynamic display enables users to identify positive flow at a glance.
Icons for previous year values and previous month values support the easy-to-understand
display concept.
1 Activity indicator at flow 4 Icon for maximum
2 Star icon: Calibrated value 5 Icon for previous month value
Calibrated value
3 Icon for previous year value
Calibrated value
The meter's display is subdivided into several loops.
A short press on the button (<2 s) lets the current loop pass through line by line. The first line
displays again after the last line. A long press (>3 s) displays the first line of the next loop.
The first loop is displayed again after the last loop.
250
10
100
1000
0.1 1 10
Flow
in m³/h
A B
C
DE
P
r
e
s
s
u
r
e
l
o
s
s
i
n
m
b
a
r
1
2
3
4
5