
Application

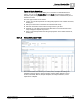
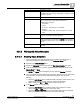
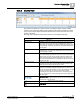
Table Of Contents
- About This Document
- 1 Overview of Graphics
- 1.1 Graphic Libraries and Folders
- 1.2 Graphics Related Folders
- 1.3 Graphics Viewer: Operating and Engineering Mode
- 1.4 Graphics Library Browser - Operating and Engineering Mode
- 1.5 Graphics Editor - Operating and Engineering Mode
- 1.6 Security and Graphics Overview
- 1.7 Scopes and Data Point Access
- 1.8 User Settings Overview
- 2 Navigation in Graphics
- 3 Overview of Graphics Viewer
- 3.1 Point Centered Mode
- 3.2 Status and Commands Overview
- 3.3 Viewing Graphic Objects
- 3.4 Viewing a Coverage Area
- 3.5 Zooming and Panning
- 3.6 Graphics Viewer Components
- 3.7 Working with the Graphics Viewer
- 3.7.1 Displaying a Graphic
- 3.7.2 Displaying Properties
- 3.7.3 Displaying and Hiding Coverage Area
- 3.7.4 Commanding Properties in Graphics Viewer
- 3.7.5 Commanding Off-Normal Properties
- 3.7.6 Navigating to a Linked Element
- 3.7.7 Enabling Point Centered Mode
- 3.7.8 Disabling Point Centered Mode
- 3.7.9 Working with the Aerial View
- 3.7.10 Using the Depths Navigation View
- 3.7.11 Zooming in the Graphics Viewer
- 3.7.12 Selecting Objects within Graphics Viewer
- 3.7.13 Dragging Object Properties from the Graphics Viewer
- 3.7.14 Selecting Objects from System Browser
- 3.7.15 Printing from the Graphics Viewer
- 3.7.16 Deleting a Graphic Item
- 3.7.17 Navigating to the Graphics Library Browser from System Browser
- 3.7.18 Creating a Graphic
- 3.7.19 Creating a Graphics Sub-Folder
- 3.7.20 Editing a Graphic
- 3.8 Graphics Viewer Appendix
- 4 Overview of Graphics Library Browser
- 5 Overview of Graphics Editor
- 5.1 Graphics Editor Modes
- 5.2 Overview of Views and the Dock Panel
- 5.3 Graphics Editor Workspace
- 5.4 Workspace Configuration
- 5.5 Working with a Graphic
- 5.5.1 Overview of Graphic Components and Types
- 5.5.2 Bitmap Images
- 5.5.3 About Graphic Viewports
- 5.5.4 Working with Graphic Viewports
- 5.5.5 Working with Graphics
- 5.5.6 Working with Linked Graphics
- 5.5.7 Working with Bitmap Transparency
- 5.5.8 Overview of the Consistency Checker
- 5.5.9 Consistency Checker Workspace
- 5.5.10 Working with the Consistency Checker
- 5.5.11 Importing Graphic Files from another Project or Custom Folder
- 5.6 Graphic Updates after an Upgrade Installation
- 5.7 Viewing a Graphic
- 5.8 Searching for Graphic Files
- 5.9 Working with AutoCAD Images
- 5.10 About Symbols
- 5.10.1 About Symbols
- 5.10.2 Generic Symbol
- 5.10.3 Object Referencing and Symbols
- 5.10.4 Symbols Styles and Function
- 5.10.5 Symbol Property Substitution
- 5.10.6 Localizing Symbols and Graphic Templates
- 5.10.7 Working with Symbols
- 5.10.7.1 Symbol Configuration Workflow
- 5.10.7.2 Associating a Symbol with an Object Type
- 5.10.7.3 Creating a Symbol
- 5.10.7.4 Deleting a Symbol
- 5.10.7.5 Deleting a Customized Symbol
- 5.10.7.6 Assigning a Data Point to a Symbol Instance on a Graphic
- 5.10.7.7 Modifying an Existing Symbol
- 5.10.7.8 Saving a Graphic or Symbol
- 5.10.7.9 Using a Symbol Instance
- 5.10.7.10 Modifying Elements in a Symbol Instance
- 5.10.7.11 Using the Symbol Style Filter
- 5.10.7.12 Replacing Symbol Instances
- 5.10.7.13 Setting the Customization Level
- 5.10.7.14 Creating a Customized HQ Symbol
- 5.10.8 Troubleshooting Symbols Error Messages
- 5.11 About Graphics Templates
- 5.12 The Graphics Library Browser
- 5.13 Overview of Elements
- 5.13.1 About Elements
- 5.13.2 About Element Handles
- 5.13.3 Element Handle Table
- 5.13.4 About Grids
- 5.13.5 About Guidelines
- 5.13.6 About Linking Elements
- 5.13.7 Grouping and Ungrouping Elements
- 5.13.8 Element Alignment and Precision
- 5.13.9 Notes on Resizing Elements
- 5.13.10 About Tooltips
- 5.13.11 Basic Element Tasks
- 5.13.11.1 Copying an Element
- 5.13.11.2 Deleting an Element
- 5.13.11.3 Linking an Element
- 5.13.11.4 Modifying Element Properties
- 5.13.11.5 Modifying or Removing a Link from an Element
- 5.13.11.6 Modifying the Angle Center
- 5.13.11.7 Moving an Element
- 5.13.11.8 Moving an Element with the Keyboard
- 5.13.11.9 Resizing Elements
- 5.13.11.10 Rotating Elements
- 5.13.11.11 Selecting Elements from the Canvas
- 5.13.11.12 Selecting Elements from the Element Tree
- 5.13.11.13 Setting the Angle Center of an Element
- 5.13.11.14 Using Copy Format
- 5.13.11.15 Locking and Unlocking an Element on the Canvas
- 5.13.12 Working with Element Groups
- 5.13.12.1 Grouping Elements
- 5.13.12.2 Joining a Group of Elements
- 5.13.12.3 Removing an Element from a Group
- 5.13.12.4 Removing a Group
- 5.13.12.5 Repositioning Inner Group Elements
- 5.13.12.6 Resizing an Element Group
- 5.13.12.7 Resizing a Single Element in a Group
- 5.13.12.8 Selecting an Element in a Group
- 5.13.12.9 Ungrouping Elements
- 5.13.13 Working with Element Arrangement
- 5.13.14 Working with Grids and Gridlines
- 5.13.14.1 Adding Guidelines
- 5.13.14.2 Changing Guideline Properties
- 5.13.14.3 Copying and Pasting a Guideline
- 5.13.14.4 Moving Guidelines
- 5.13.14.5 Locking a Guideline
- 5.13.14.6 UnLocking a Guideline
- 5.13.14.7 Deleting a Guideline
- 5.13.14.8 Displaying or Hiding Guidelines
- 5.13.14.9 Displaying and Clearing the Grid
- 5.13.14.10 Enabling or Disabling Snap
- 5.13.14.11 Changing Grid Properties
- 5.13.15 Working with the Stroke Group
- 5.13.16 Working with Element Alignment
- 5.13.16.1 Aligning Elements Horizontally
- 5.13.16.2 Aligning Elements to the Bottom
- 5.13.16.3 Aligning Elements to the Center
- 5.13.16.4 Aligning Elements to the Left
- 5.13.16.5 Aligning Elements to the Middle
- 5.13.16.6 Aligning Elements to the Right
- 5.13.16.7 Aligning Elements to the Top
- 5.13.16.8 Aligning Elements Vertically
- 5.13.16.9 Aligning Elements to Wrap
- 5.13.16.10 Alignment and Multiple Drag-and-Drop
- 5.14 Working with Element Types
- 5.14.1 Animation Element
- 5.14.2 Working with Animation
- 5.14.3 Ellipse Element
- 5.14.4 Working with the Ellipse Element
- 5.14.5 Import AutoCAD Element
- 5.14.6 Import .XML Element
- 5.14.7 Line Element
- 5.14.8 Working with the Line Element
- 5.14.9 Text Element
- 5.14.10 Working with the Text Element
- 5.14.11 Path Element
- 5.14.12 Working with the Path Element
- 5.14.12.1 Drawing with the Path Element
- 5.14.12.2 Modifying a Path Segment
- 5.14.12.3 Removing a Path Segment
- 5.14.12.4 Modifying an Arc Segment
- 5.14.12.5 Modifying a Cubic Bezier
- 5.14.12.6 Modifying a Quadratic Bezier
- 5.14.12.7 Working with the Combine Feature
- 5.14.12.8 Creating a Union
- 5.14.12.9 Intersecting Elements
- 5.14.12.10 Using the Exclude Overlap Feature
- 5.14.12.11 Using the Subtraction Feature
- 5.14.13 Polygon Element
- 5.14.14 Working with the Polygon Element
- 5.14.15 Rectangle Element
- 5.14.16 Working with the Rectangle Element
- 5.14.17 Import Raster Image Element
- 5.14.18 Working with Imported Images
- 5.15 Formatting Elements
- 5.16 The Element Tree and Layers
- 5.17 Working with the Brush View and Brushes Group
- 5.17.1 Brush View and Brushes Group Overview
- 5.17.2 State Color Overview
- 5.17.3 Brush Editor View
- 5.17.4 Brush Editor View Tasks
- 5.17.4.1 Applying Background Color Using the Brush Editor View
- 5.17.4.2 Applying Fills using the Brush Editor View
- 5.17.4.3 Applying Linear Gradients
- 5.17.4.4 Applying Radial Gradients
- 5.17.4.5 Applying a Stroke Using the Brush Editor
- 5.17.4.6 Copying and Pasting a Brush
- 5.17.4.7 Applying the Toggle-Blinking Brush
- 5.17.4.8 Setting HSV
- 5.17.4.9 Using the Color Eyedropper
- 5.17.5 Brushes Group Tasks
- 5.18 About Evaluations and Element Properties
- 5.19 Working with Evaluations and Element Properties
- 5.20 Working with Coverage Area
- 5.21 Working with Value Simulation
- 5.22 About Depths
- 5.23 Overview of Printing
- 5.23.1 Print Preview
- 5.23.2 Page Setup View
- 5.23.3 Working with Printing
- 5.23.3.1 Aligning a Graphic on the Print Page
- 5.23.3.2 Customizing the Header and Footer Fonts
- 5.23.3.3 Inserting Headers and Footers
- 5.23.3.4 Inserting Page Numbers
- 5.23.3.5 Previewing a Document to Print
- 5.23.3.6 Printing Documents
- 5.23.3.7 Saving Page Setup Settings
- 5.23.3.8 Working with Page Setup
- 5.23.3.9 Working with the Image Library Window
- 5.24 Graphics Editor Appendix
- 5.24.1 Context Menus
- 5.24.1.1 Graphic Context Menu
- 5.24.1.2 Print Preview Context Menu
- 5.24.1.3 Selection Context Menu
- 5.24.1.4 Copy Format Table
- 5.24.1.5 Status and Commands Menu
- 5.24.1.6 Library Browser Context Menu
- 5.24.1.7 Tab Context Menu
- 5.24.1.8 Task Menu - Consistency Checker
- 5.24.1.9 Findings Menu - Consistency Checker
- 5.24.2 Graphics Editor Keyboard Shortcuts
- 5.24.2.1 Element Tree View Keyboard Shortcuts
- 5.24.2.2 Element Keyboard Shortcuts
- 5.24.2.3 Angle Center Keyboard and Mouse Shortcuts
- 5.24.2.4 Arc and Pie Angle Keyboard Shortcuts
- 5.24.2.5 Draw Keyboard and Mouse Shortcuts
- 5.24.2.6 Modify Line and Path Keyboard and Mouse Shortcuts
- 5.24.2.7 Move Keyboard and Mouse Shortcuts
- 5.24.2.8 Resize Keyboard and Mouse Shortcuts
- 5.24.2.9 Rectangle Radius Keyboard Shortcuts
- 5.24.2.10 Rotate Keyboard and Mouse Shortcuts
- 5.24.2.11 Rubberband Key and Mouse Shortcuts
- 5.24.2.12 Find and Replace View Shortcuts
- 5.24.2.13 General Keyboard Shortcuts
- 5.24.2.14 Inline Text Element Shortcuts
- 5.24.2.15 Path Shortcuts
- 5.24.3 Table of Element Handles
- 5.24.4 Element and Graphic Properties
- 5.24.4.1 3D Effects
- 5.24.4.2 Advanced
- 5.24.4.3 Animation
- 5.24.4.4 Clip
- 5.24.4.5 Colors
- 5.24.4.6 Ellipse
- 5.24.4.7 General
- 5.24.4.8 Graphic
- 5.24.4.9 Layer
- 5.24.4.10 Layout
- 5.24.4.11 Navigation
- 5.24.4.12 Path
- 5.24.4.13 Polygon
- 5.24.4.14 Rectangle
- 5.24.4.15 Replication
- 5.24.4.16 Stroke
- 5.24.4.17 Substitutions
- 5.24.4.18 Symbol Instance
- 5.24.4.19 Text Element
- 5.24.4.20 Workspace
- 5.24.5 Property Name and Variable Names
- 5.24.6 Error Messages and Troubleshooting Graphics Engineering
- 5.24.7 HTML Literal Word Colors
- 5.24.8 Troubleshooting AutoCAD Conversion
- 5.24.1 Context Menus

5
Overview of Graphics Editor
Working with Value Simulation
244
Siemens Industry, Inc. Graphics Editor Version 2.1 A6V10380527_en_a_21
Building Technologies 2015-06-23
4. To add color to the coverage area, go to the Home tab, select the Brush Editor
group, select and then select a color.
TIP: To revert back to the default state of the Symbol Instance, right-click
and select
Revert to Default. All changes to the Symbol Instance are cleared.
Additionally, if you hover over the arrow, it lists the changes made to the
elements within the Symbol Instance.
5. To associate other objects or devices, such as sensors, etc. to the coverage area,
do one of the following or do both if needed:
– Drag-and-drop a detector or sensor from the System Browser > Management
View on to the graphic. Repeat as needed until you have all the devices you
want monitored in the coverage area.
– For existing detectors, sensors or any elements associated with a data point
already on the graphic, drag-and-drop the detector\sensor objects into the
coverage area.
6. To edit elements within the Symbol Instance, see Modifying Elements in a Symbol
Instance [➙ 128].
7. Once you have added modified the coverage area by adding objects and adjusting
the coverage area size, from the Graphics Editor toolbar click .
All the objects that are within a coverage area on any layer are now associated to
the main object or device. When you select the device in System Browser, Related
Items displays the main object.
5.21 Working with Value Simulation
5.21.1 About Value Simulation
Value simulation allows you to simulate COVs for data points while not online. You can
test a graphics elements whose properties have values and expressions attributed to
them when you are offline and do not have a live database to work with.
The Value Simulator populates when you have a graphic open with values attributed to
them. You can control the simulation of the data point in two ways: to control values of
data points.
Automatic – the value simulator generates values based on a mathematical function
cycle.
Manual - The value simulation can be changed manually through a slider.
You can also adjust the value range settings of the simulation and filter the data points
displayed in the Object Selection section of the view.